Climate Matters•April 5, 2023
Shifting Planting Zones
KEY CONCEPTS
Plant hardiness zones are shifting north as the U.S. warms, affecting farmers and gardeners.
These zones—based on each location’s average annual minimum temperature—determine which plants can grow and thrive in different parts of the country.
As the coldest times of year warm, plant hardiness zones across the contiguous U.S. have shifted to the north over the three most recent 30-year normal periods.
Average annual minimum temperatures warmed in 231 (95%) of 242 U.S. locations analyzed. These 231 locations warmed by 3.3°F on average since the 1951-1980 period.
If heat-trapping carbon pollution continues these shifts could force growers to select plants adapted to a wider and warmer range of temperatures.
Plant hardiness zones
As gardeners and farmers across the country decide which plants to grow this spring, many look to plant hardiness zones for guidance.
The U.S. (including Alaska and Hawaii) is divided into 13 plant hardiness zones based on each location’s annual minimum temperature, averaged over 30-year normal periods. Each zone spans a 10°F range in average annual minimum temperature. For example:
Cold-tolerant plants such as garlic and asparagus thrive in Zone 3 (-40 to -30°F), which runs across the upper Northeast, Midwest, and Plains.
Plants adapted to mild winters and hot summers, such as watermelons and tangerines, thrive in Zone 8 (10 to 20°F), which runs through the Southeast and central Texas.
Maps from USDA and NOAA show bands of similar planting zones running roughly east to west across the U.S. (except in high mountains and along coasts).
A location's annual minimum temperatures (on which planting zones are based) affect which plants and insects can survive over winter—and therefore partly determine the geographic range of wild, cultivated, and invasive species. The USDA also uses plant hardiness zones to set some crop insurance standards.
In addition to annual minimum temperature, other factors such as growing degree days, local rainfall, and soil type also affect which plants can thrive in a given area.
Planting zones shifting north across the U.S.
As our climate warms due to heat-trapping carbon pollution, planting zones have shifted north toward higher latitudes and elevations.
Planting zones are based on annual minimum normal temperatures, and winter warmed the most between the 1981-2010 and 1991-2020 normal periods.
Maps for the three most recent normal periods show plant hardiness zones shifting to the north as the coldest time of year warms.
As minimum temperatures warm and a location's planting zone increases (e.g., from Zone 5 to Zone 6), certain plants and insects may expand into areas where they previously wouldn't have survived the coldest winter temperatures.
While this can have benefits (e.g., expanding the range of high-value crops), it can also expand the range of harmful and/or invasive plant and insect species such as:
Kudzu, a fast-growing invasive vine projected to continue to expand from the Southeast into the Mid-Atlantic, Midwest, and Northeast.
Brown marmorated stink bug, an urban nuisance pest and agricultural pest in at least 15 states, whose geographic range is projected to grow partly due to warmer, wetter winters.
Coldest annual temperatures warming locally
Climate Central also assessed the long-term change in the coldest temperatures of the year—which determines which plants are likely to thrive—in 247 U.S. locations. Summary statistics below are based on 242 locations (see Methodology).
This analysis averaged each location’s annual minimum temperatures over a rolling 30-year period, from 1951-1980 to the present (1993-2022), and found:
Average annual minimum temperatures warmed in 231 (95%) of 242 locations.
Compared to a 1951-1980 baseline, the average annual minimum temperatures during the most recent 30-year period (1993-2022) were 3.1°F warmer on average across all 242 U.S. locations.
121 (50%) of the 242 locations experienced an increase in their plant hardiness zone (e.g., from Zone 5 to Zone 6) at some point over the period of analysis.
The locations that experienced the largest increase in average annual minimum temperatures between the first (1951-1980) and last (1993-2022) 30-year periods were: Reno, Nev. (9.3°F); Anchorage, Alaska (8.7°F); Las Vegas, Nev. (8.6°F); Las Cruces, Texas (8°F); Juneau, Alaska (7.8°F).
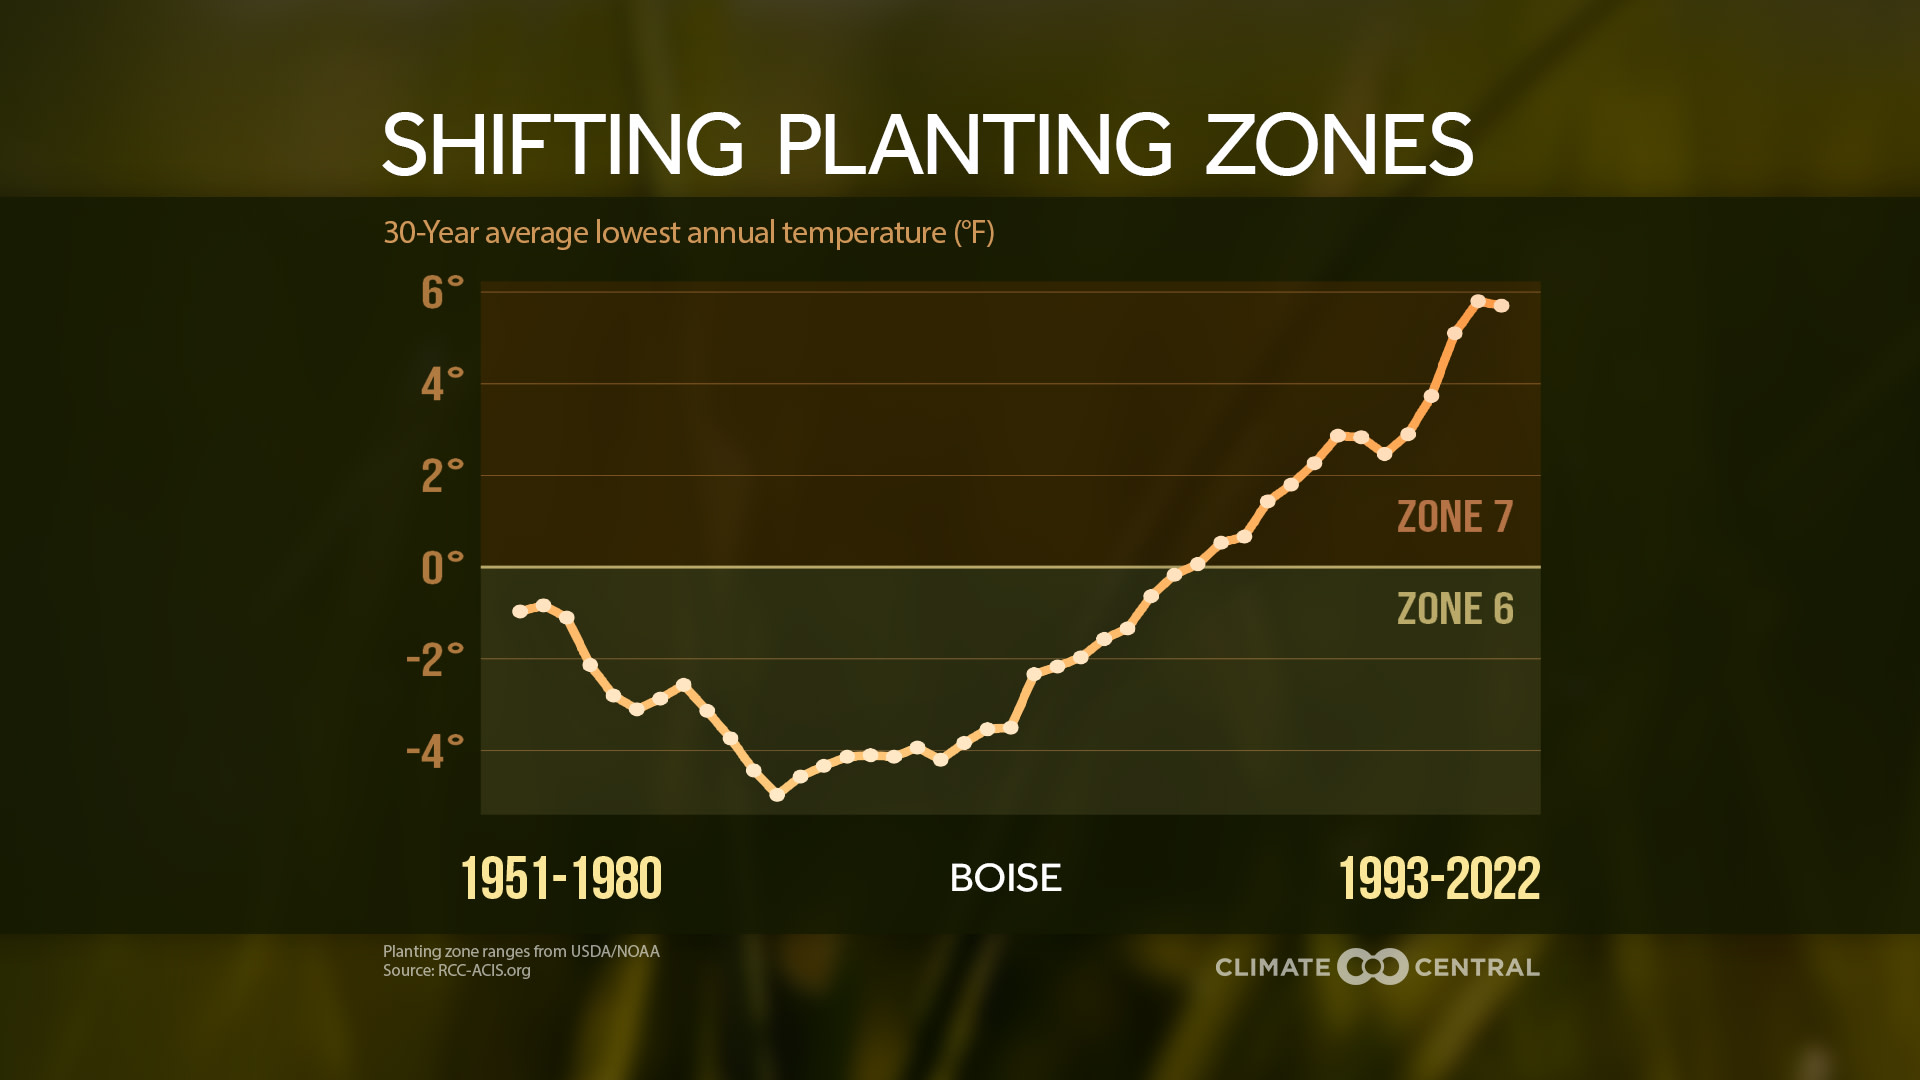
The largest differences between lowest and highest average annual minimum temperatures observed over the period of analysis were in:
Boise, Idaho warmed 10.8°F (from -5°F to 5.8°F), equivalent to a shift from Zone 6 to Zone 7
Bowling Green, Ky. warmed 9.6°F (from -4.2°F to 5.4°F), equivalent to a shift from Zone 6 to Zone 7
Nashville, Tenn. warmed 9.5°F (from -0.3°F to 9.2°F), equivalent to a shift from Zone 6 to Zone 7
Growing in a warming world
As planting zones shift toward higher latitudes and elevations, it affects which plants can grow successfully in different parts of the country.
If carbon pollution continues, these shifts could continue or even accelerate—forcing farmers and gardeners to adapt by selecting plants adapted to a wider and warmer range of temperatures.
Research from the USDA projects dramatic northward shifts in future plant hardiness zones with continued carbon pollution.
Another study found that, if carbon pollution continues, annual minimum temperatures could shift north at a rate of about 13 miles per decade—with the northern Great Plains and the Midwest expected to see the fastest shifts.
Although this would mean expanded ranges for high-value crops such as almonds, oranges, and kiwis, it could also bring expanded ranges for weeds and pests.
LOCAL STORY ANGLES
What’s your plant hardiness zone?
Search any address or zip code in the USDA’s latest plant hardiness zone map, which includes Alaska, Hawaii, and Puerto Rico. NOAA offers similar maps for the contiguous U.S., focused on shifts between the 1971-2000 and 1981-2010 normal periods.
How is spring progressing in your local area?
The U.S. National Phenology Network tracks signs of spring’s progress and forecasts the annual development of 18 different insects and invasive plants across the U.S.
How is climate change affecting plant growth near you?
Check how growing degree days have changed in your local area from 1970 to 2021. A 2022 report from the USDA and U.S. Forest Service (USFS), Climate Change Pressures in the 21st Century, assesses historical and projected future changes in three plant growth metrics: growing degree days, plant hardiness zones, and heat zones. Search your location and favorite plant in Botanic Gardens Conservation International’s Climate Assessment Tool to see the future suitability of growth conditions in your local area under different warming scenarios.
How are local gardens adapting to warmer conditions?
The USFS Climate Change Tree Atlas explores current and future adaptation potential for 125 of the most common tree species in the eastern U.S. The Atlas includes detailed summaries of tree adaptability under different warming scenarios for 185 urban areas. Search by address or zip code for a public garden in your area to learn about ongoing climate adaptation and resilience efforts for local plants.
CONTACT EXPERTS
Erica Kistner-Thomas, PhD
National Program Leader
U.S. Department of Agriculture - National Institute of Food and Agriculture
Related expertise: climate impacts on invasive agricultural pests
Contact: erica.kistnerthomas@usda.gov
Javier Gutierrez Illan, PhD (he/him/his)
Research Assistant Professor
Washington State University
Related expertise: insect expansion towards colder zones
Contact: javier.illan@wsu.edu
*Available for interviews in Spanish and English
Tanisha M. Williams, PhD (she/her/hers)
Richard E. & Yvonne Smith Postdoctoral Fellow in Botany
Bucknell University
Related expertise: Climate change ecology; species distribution modeling
Contact: tmw018@bucknell.edu
Ailene Ettinger, PhD (she/her)
Quantitative Ecologist
The Nature Conservancy
Related expertise: Plant ecology and global change
Contact: ailene.ettinger@tnc.org
FIND EXPERTS
Submit a request to SciLine from the American Association for the Advancement of Science or to the Climate Data Concierge from Columbia University. These free services rapidly connect journalists to relevant scientific experts.
Browse maps of climate experts and services at regional NOAA, USDA, and Department of the Interior offices.
Explore databases such as 500 Women Scientists, BIPOC Climate and Energy Justice PhDs, and Diverse Sources to find and amplify diverse expert voices.
Reach out to your State Climate Office or the nearest Land-Grant University to connect with scientists, educators, and extension staff in your local area.
METHODOLOGY
Annual minimum temperatures from 1951-2022 were obtained from the Applied Climate Information System and used to calculate rolling 30-year averages. Climate Central's local analyses include 247 stations. However, statistics in this release are based on 242 due to insufficient data over the first 30-year period (less than 50% of years from 1951-1980) in Dothan, Ala., Hazard, Ky., Laredo, Texas, Panama City, Fla., and Wheeling, W. Va. Planting zone temperature ranges are based on USDA/NOAA.
For the national maps, NOAA/NCEI’s nClimGrid-Daily temperature dataset was used to calculate average annual minimum temperatures over the 1971-2000, 1981-2010, and 1991-2020 climate normal periods.