Climate Matters•December 14, 2023
Record Global Temperatures and U.S. Billion-Dollar Disasters
KEY CONCEPTS
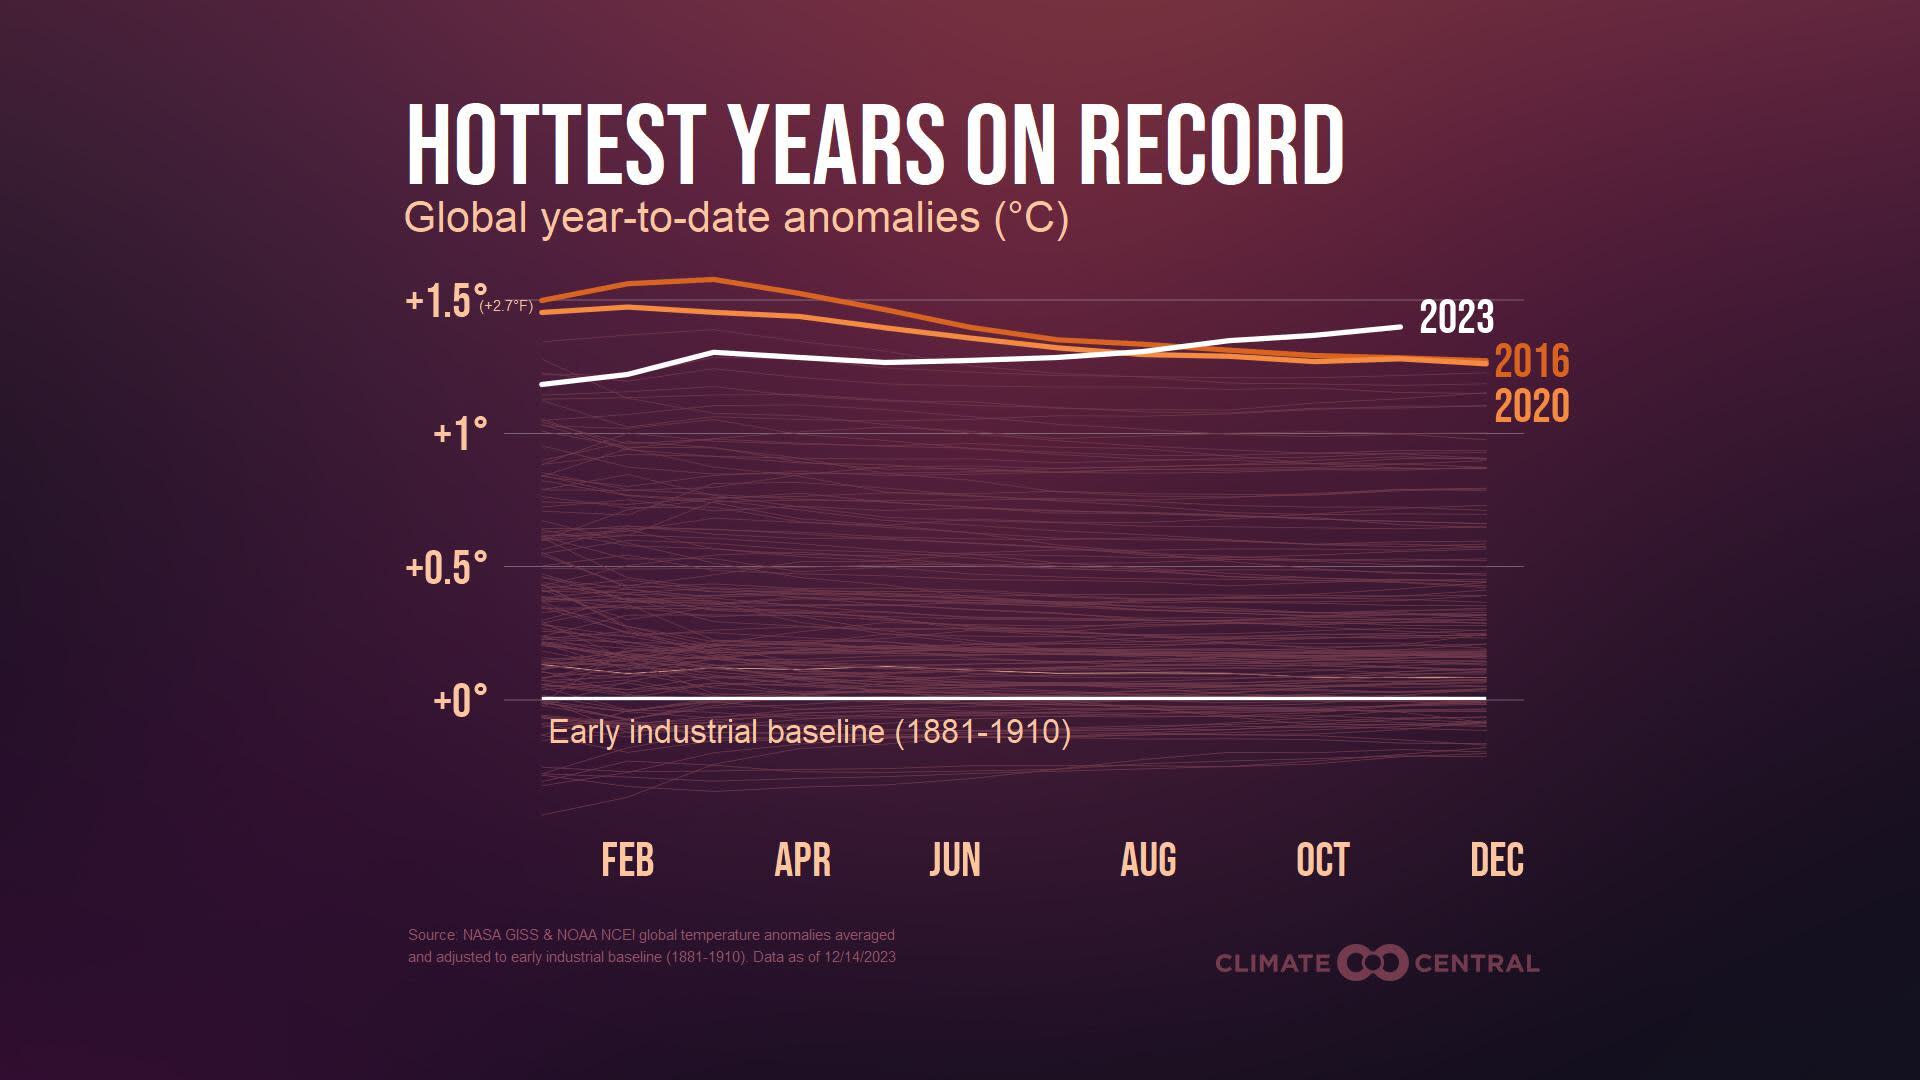
Record heat-trapping pollution is pushing the planet toward new temperature records. It’s virtually certain that 2023 will be Earth’s hottest year on record.
According to combined NOAA and NASA data, 2023 global temperatures through November ranked highest in the 144-year record.
As the planet warms, many dangerous extreme events are becoming more frequent and intense.
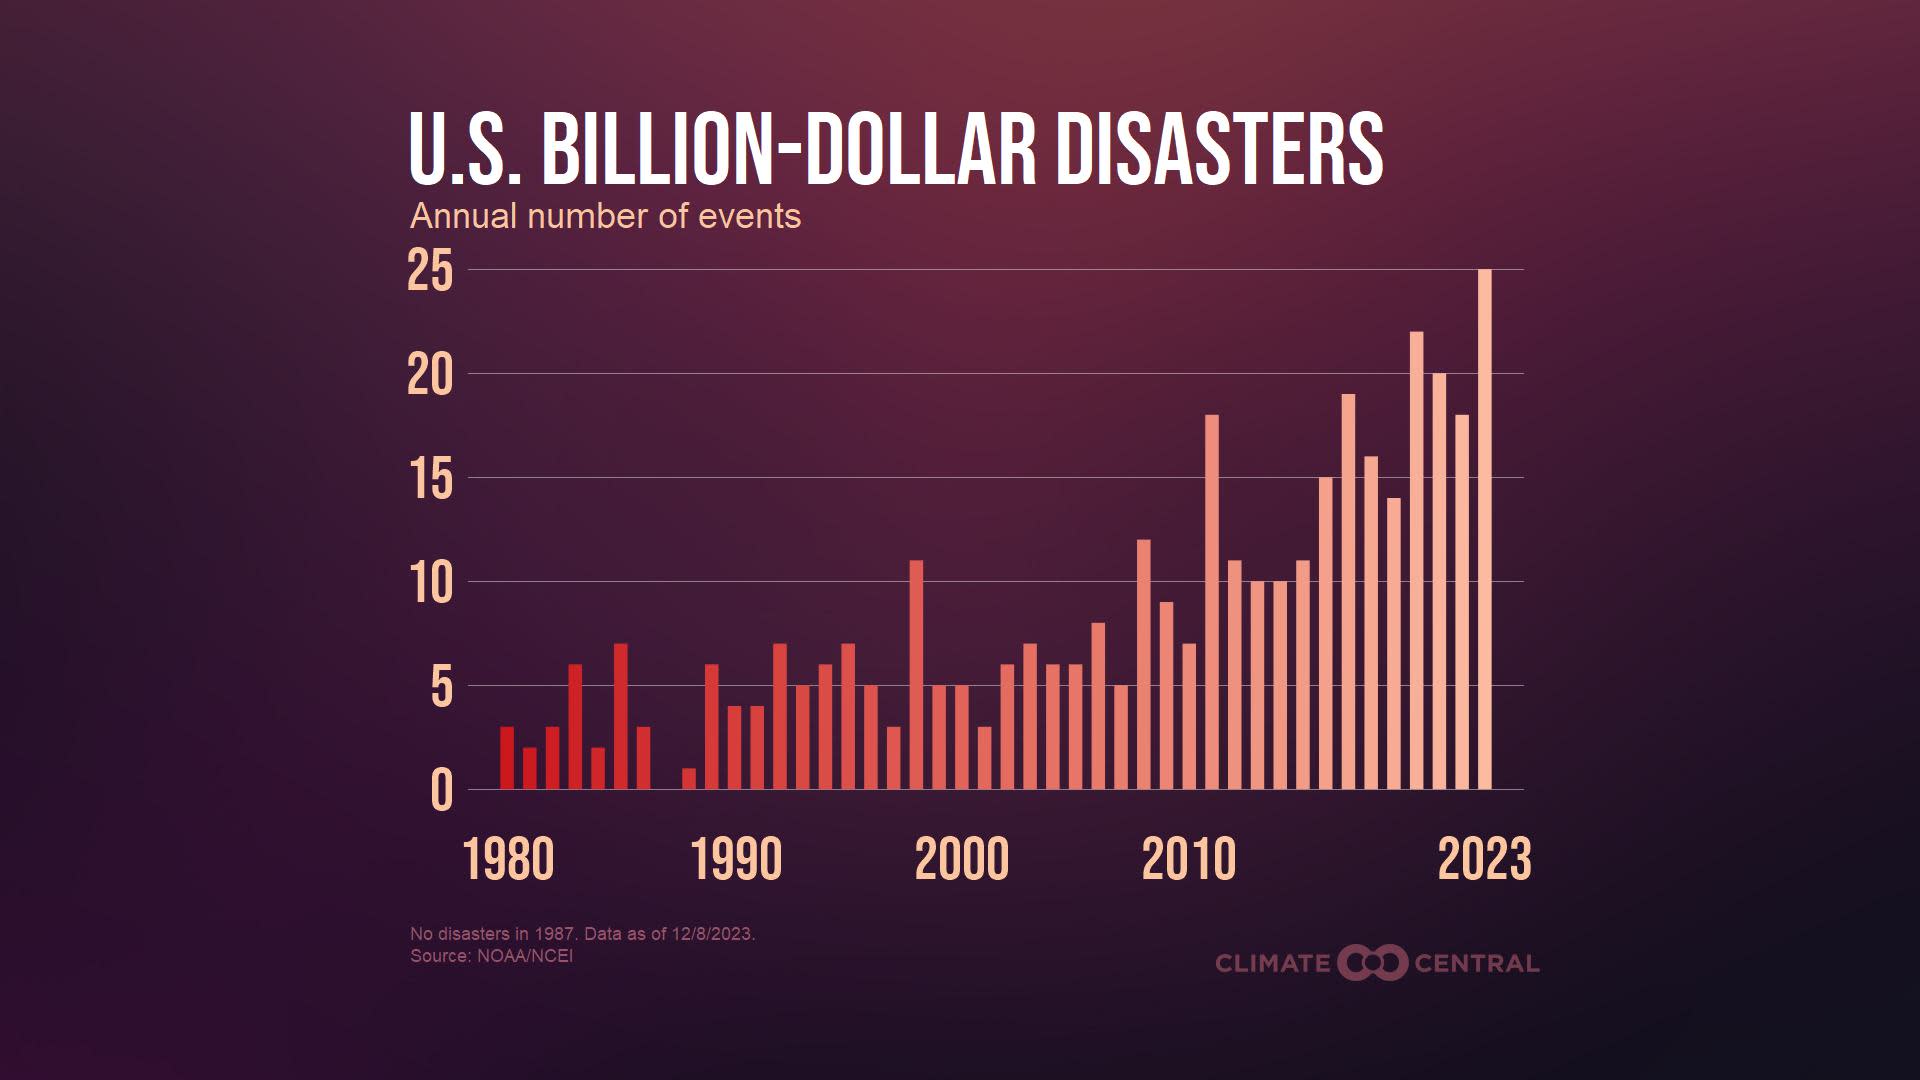
The U.S. has experienced a record 25 billion-dollar weather and climate disasters so far in 2023.
The frequency of billion-dollar disasters has increased dramatically since 1980.
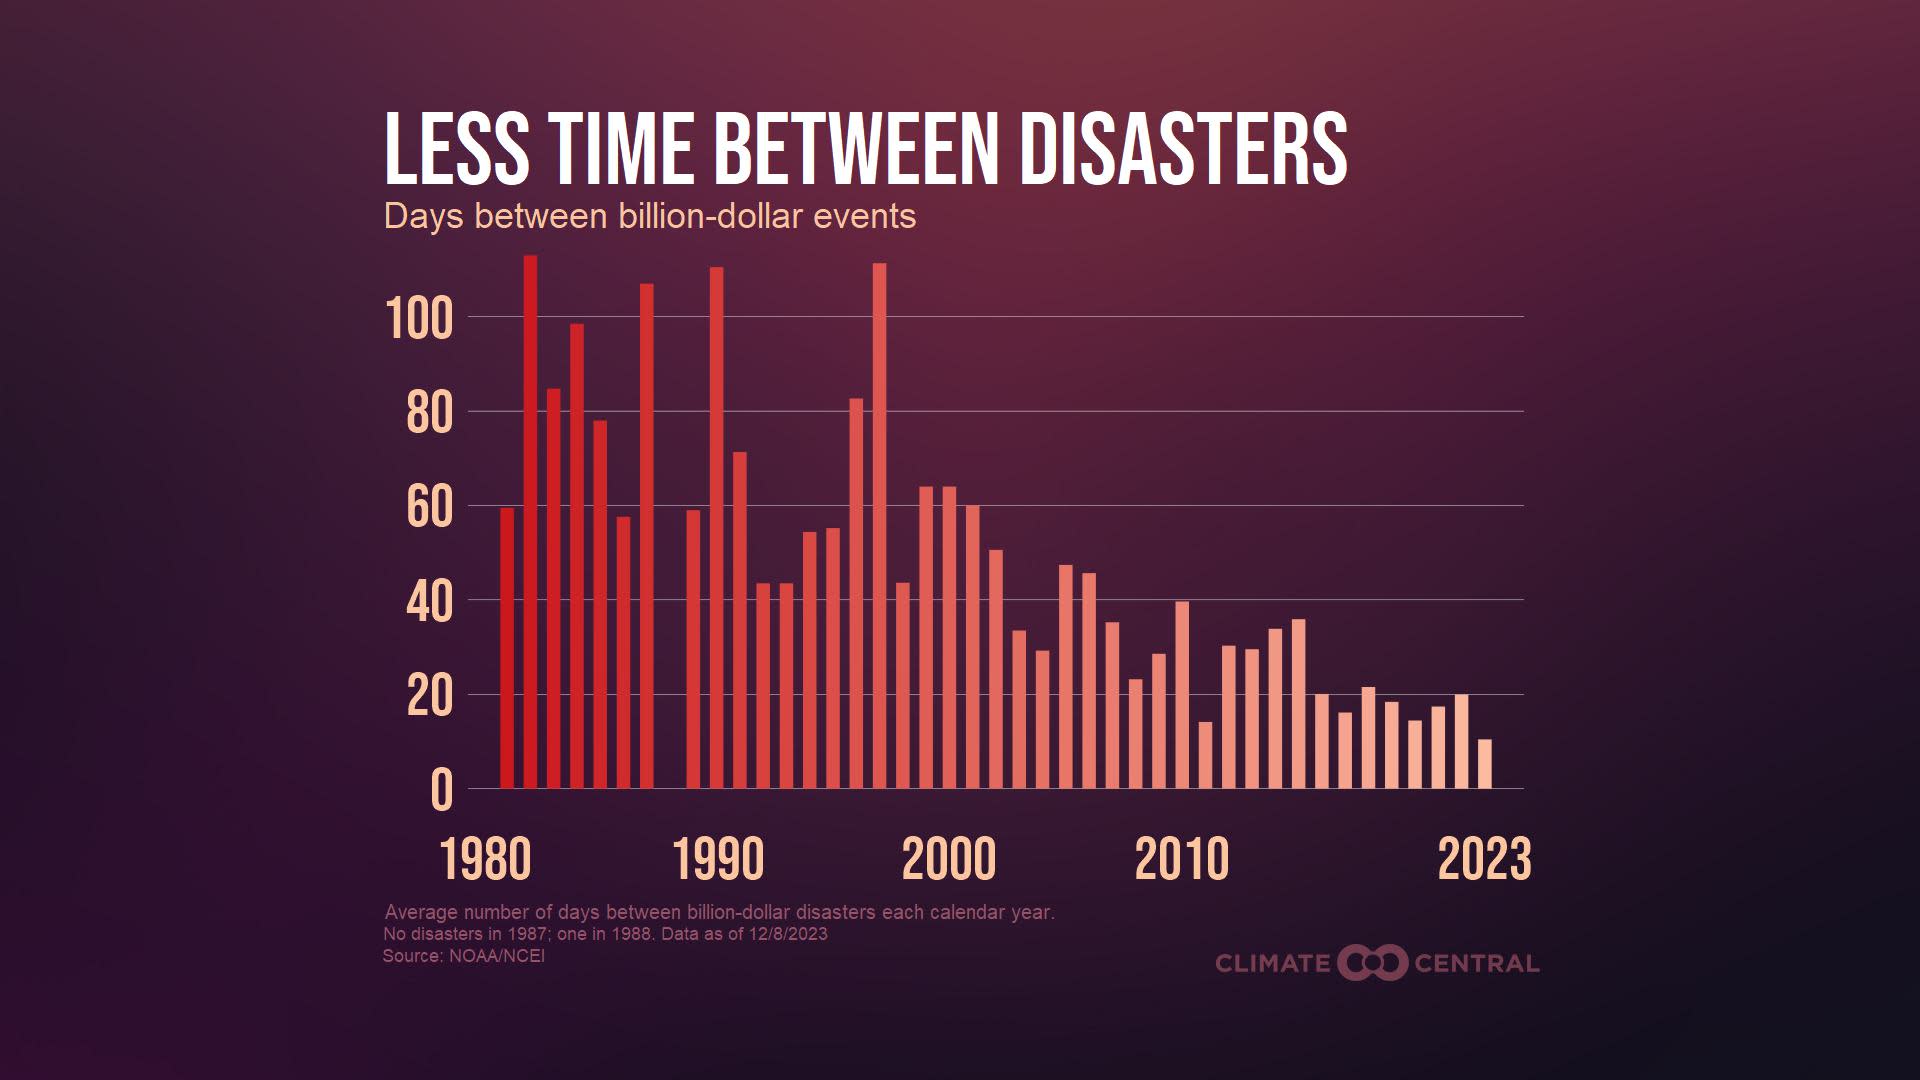
The average time between billion-dollar disasters in 2023 (through November) was just 10 days.
Record highs: carbon pollution, global temperatures
Carbon pollution from burning coal, oil, and natural gas has never been higher, according to the latest Global Carbon Project study. This heat-trapping pollution is pushing the planet toward new temperature records.
With just over two weeks left in the year, it is virtually certain that 2023 will be Earth’s hottest year on record. This year has now seen a total of six record-breaking months (June through November) spanning two record-breaking seasons (summer and fall).
During 2023’s record-hottest summer (June - August), nearly half of the world’s population experienced 30 or more days with hot temperatures made at least three times more likely by human-caused climate change.
According to the latest combined data from NOAA and NASA, year-to-date (January through November 2023) global surface temperature ranked highest in the 144-year record at 1.4°C (2.52°F) above the early industrial (1881-1910) baseline average.
Stay tuned: On January 12, 2024, NOAA will release global temperature data for all of 2023 and Climate Matters will provide related reporting resources.
More warming, more extremes
As the planet warms, many dangerous extreme events — from heat waves to wildfires and heavy rainfall and flooding — have become more frequent and intense.
The rise in weather and climate extremes is consistent with well-established science on the consequences of carbon pollution — mainly from burning coal, oil, and natural gas.
According to the latest IPCC reports: “It is an established fact that human-induced greenhouse gas emissions have led to an increased frequency and/or intensity of some weather and climate extremes since pre-industrial time, in particular for temperature extremes.”
These extreme events put health and safety, livelihoods, infrastructure, and ecosystems at risk.
In the U.S., we’ve seen the links between carbon pollution, global heating, and rising extremes play out in a record-breaking number of billion-dollar weather and climate disasters.
More U.S. billion-dollar disasters than ever before
The U.S. has experienced a record 25 billion-dollar weather and climate disasters from January through November 2023 — exceeding the previous annual record of 22 events in 2020.
Billion-dollar disasters thus far in 2023 have resulted in an estimated 482 deaths and $81 billion in damages.
Severe storms accounted for 19 (76%) of all billion-dollar disasters so far this year — continuing a dramatic rise in billion-dollar severe storms since 1980.
All but four states (Alaska, Utah, Nevada, and Idaho) were affected by billion-dollar disasters in 2023.
More disasters, more often
The frequency of billion-dollar disasters has increased dramatically since 1980, fueled by heat-trapping pollution and by the growing number of people, homes, and businesses at risk.
Climate Central analysis found that the average time between billion-dollar disasters dropped from 82 days in the 1980s to just 18 days on average in recent years (2018-2022).
During the first 11 months of 2023, the average time between billion-dollar disasters was just 10 days.
Having less time between disasters can strain the resources available for communities to respond, recover quickly, and manage future risks.
Often, these risks aren’t equally shared. According to the Fifth National Climate Assessment: “Low-income communities, communities of color, and Tribes and Indigenous Peoples experience high exposure and vulnerability to extreme events due to both their proximity to hazard-prone areas and lack of adequate infrastructure or disaster management resources.”
Billion-dollar disasters in 2023:
NOAA’s billion-dollar disasters database, now updated monthly instead of quarterly, does not include extreme heat events, however Climate Central analysis found that 97% of the U.S. population experienced at least one summer day with hot temperatures made at least 2x more likely due to human-caused climate change.
The same analysis also found that many relentless heat streaks in Puerto Rico and across the southern tier of the U.S. were boosted by human-caused climate change.
The following list of select billion-dollar disasters in 2023 includes many types of events that are often made more frequent and/or intense in a warming climate.
Wildfire and smoke: Climate change more than doubled the likelihood of extreme fire weather conditions in eastern Canada in May and June that began Canada’s record fire season and brought record levels of harmful wildfire smoke to the U.S.
In August, the deadliest U.S. fire in over a century devastated the historic town of Lahaina on the Hawaiian island of Maui, resulting in an estimated 100 deaths and $5.6 billion in damage.
Drought: From April through September, Southern and Midwestern states experienced extreme drought conditions, which damaged crops, increased livestock feeding costs, and impacted commerce along the Mississippi River due to low water levels. This widespread drought cost at least $10.5 billion and accounts for 244 deaths — half of all deaths from billion-dollar disasters this year.
Severe storms: Of this year’s 25 billion-dollar disasters through November, 19 (76%) were severe storms.
This spring, a historic tornado outbreak of at least 145 tornadoes caused widespread destruction across the Central U.S., damaging homes, business, vehicles, and other infrastructure. Southern and Eastern states were also heavily impacted by high wind, tornadoes, and severe storms.
This spring and summer, storms ravaged most of the United States, with hail storms causing damage in Colorado and extreme precipitation and high winds impacting numerous Central and Eastern states.
Heavy rainfall and flooding: A series of at least 12 atmospheric rivers through March 2023 produced record precipitation and severe flooding in California that caused nearly $5 billion in damage, while also alleviating multi-year drought conditions in the state.
In July 2023, exceptionally heavy rainfall and flooding devastated parts of the Northeast, with some areas reporting up to eight inches of rainfall within 24-hours.
Hurricane Idalia: At the end of August, Hurricane Idalia made landfall in the Big Bend region of Florida as a strong Category 3 hurricane, with heavy rainfall extending into Georgia and the Carolinas.
LOCAL STORY ANGLES
Today’s climate impacts — on health, ecosystems, and economies — reflect about 1.1°C (2.0°F) of global warming. These impacts worsen with every bit of additional warming.
The science shows that if we commit to rapid and sustained cuts in carbon pollution, it could set younger generations on a path toward a far safer future with less warming and fewer risky extreme events.
Many of the solutions we need to reduce emissions and thus choose this safer future are already available. Climate Central resources show progress and potential in every state:
State Solar and Wind Boom to Bring U.S. Toward Climate Targets shows that current policies are projected to boost clean energy, cut carbon pollution, and bring the U.S. closer to its climate targets. See how wind and solar energy are set to grow in your state under current policies.
Climate Solutions in Every State reviews options to quickly reduce emissions in each U.S. state’s top-emitting sector.
Learn more about solutions that can bring the U.S. closer to net-zero emissions by 2050 — and ensure a safer future for younger generations.
FIND EXPERTS
Submit a request to SciLine from the American Association for the Advancement of Science or to the Climate Data Concierge from Columbia University. These free services rapidly connect journalists to relevant scientific experts.
Browse maps of climate experts and services at regional NOAA, USDA, and Department of the Interior offices.
Explore databases such as 500 Women Scientists, BIPOC Climate and Energy Justice PhDs, and Diverse Sources to find and amplify diverse expert voices.
Reach out to your State Climate Office or the nearest Land-Grant University to connect with scientists, educators, and extension staff in your local area.
METHODOLOGY
Global temperature anomaly data as of December 14, 2023. Monthly global temperature analyses are independently calculated by NASA and NOAA/NCEI. Climate Central combines the NOAA and NASA information to re-baseline global temperatures using an earlier pre-industrial baseline of 1881-1910 in response to the Paris Climate Change Agreement. NOAA data begins in 1850 and NASA data begins in 1880. Climate Central’s rankings are based on the longest period of overlap, beginning in 1880. NASA’s calculations are extended to account for temperature changes at the poles, where there are fewer stations. NOAA does not use any extrapolation to account for low station density at the poles.
All U.S. billion-dollar weather and climate disasters data are from: NOAA National Centers for Environmental Information (NCEI) U.S. Billion-Dollar Weather and Climate Disasters (2023). https://www.ncei.noaa.gov/access/billions/ (DOI: 10.25921/stkw-7w73).
All billion-dollar disaster cost estimates included in this Climate Matters are CPI-adjusted.
The time between U.S. billion-dollar disasters was calculated by measuring the time between the start date of each disaster as recorded by NOAA/NCEI. The difference in days was only for calendar year events, with the first event of the calendar year set as the first date. For this reason, there are no data points for 1987 and 1988, which had zero events and only one event, respectively.