Climate Matters•May 14, 2025
Climate Change Nearly Doubled Pregnancy Heat Risk Days in U.S.
KEY CONCEPTS
Climate Central’s new global analysis shows that human-caused climate change has at least doubled the average number of pregnancy heat-risk days (extremely hot days associated with increased risk of preterm birth) in 222 countries from 2020 to 2024.
In the U.S., climate change added 12 (48%) of the 25 average annual pregnancy heat-risk days experienced during the last five years.
All 50 U.S. states and the District of Columbia experienced at least one additional week’s worth of pregnancy heat-risk days due to climate change, on average annually.
Cities across the U.S. Southwest had the highest average number of pregnancy heat-risk days added by climate change.
In addition to extreme heat, climate change-related extreme weather events put pregnant people at risk from air pollution, flooding, infrastructure damages, and prenatal stress.
Extreme heat puts pregnant people at risk
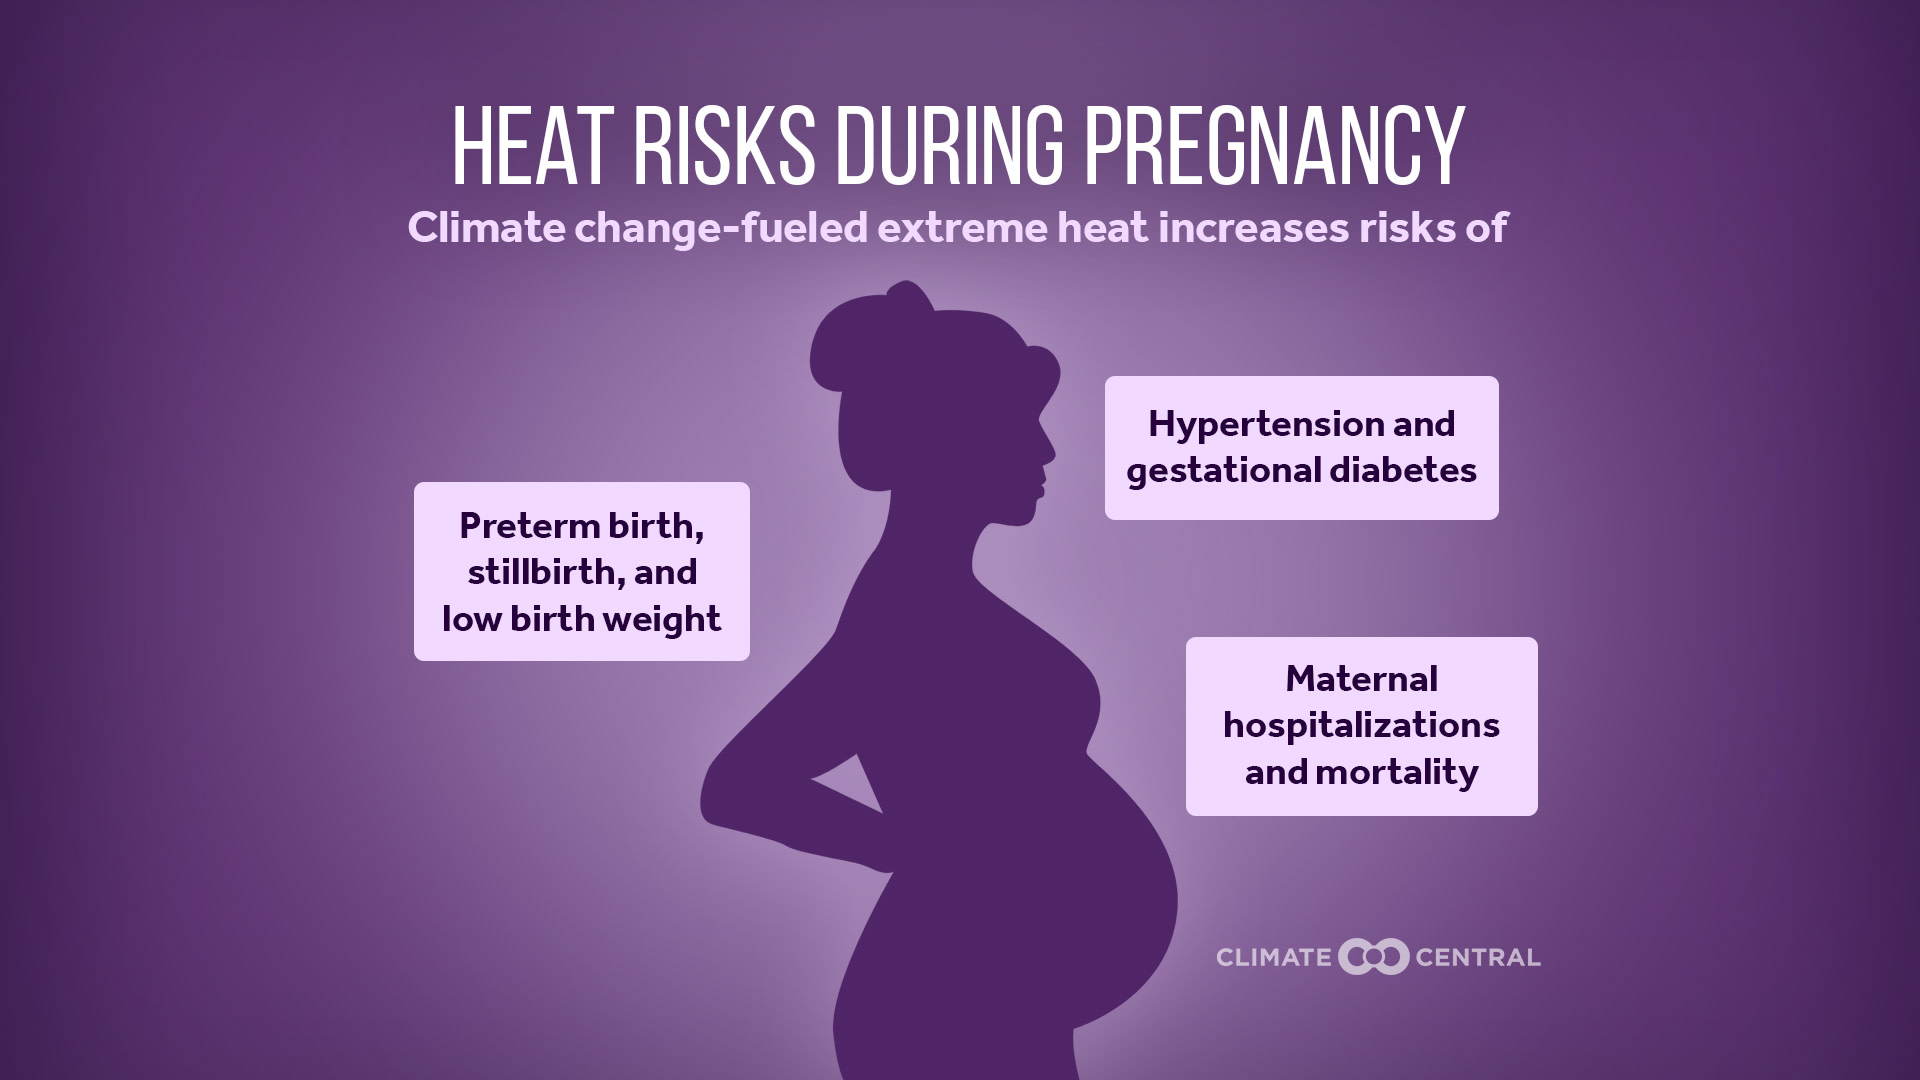
Extreme heat presents dangerous risks to global maternal health and birth outcomes.
Exposure to extreme heat during pregnancy has been linked to higher risks of complications, maternal hospitalizations, and severe maternal morbidity. It’s also associated with an increased risk of adverse outcomes such as stillbirth and preterm birth, which can have lasting health effects on the baby.
According to the U.S. Centers for Disease Control and Prevention, even a single day of extreme heat can increase the risk of pregnancy complications. Risks are especially acute for Black and Hispanic women in the U.S., whose risk of experiencing preterm birth or stillbirth with heat exposure is double that of white women.
Climate change is increasing pregnancy heat-risk days
Climate Central’s new report, Climate change increasing pregnancy risks around the world due to extreme heat, quantifies how climate change is influencing the extreme heat associated with increased risks of preterm birth around the globe.
This analysis used Climate Central’s Climate Shift Index (CSI) to quantify the average annual number of pregnancy heat-risk days added by climate change from 2020 to 2024 in 247 countries and territories and 940 global cities. See Pregnancy heat risks in a period of unprecedented warming for context.
Pregnancy heat-risk days, as defined in this analysis, are days that are hotter than 95% of local temperatures from 1991-2020. Research shows that this heat threshold can bring increased risk of preterm birth (see Methodology for details).
This analysis compared the number of pregnancy heat-risk days that would have occured in a world without human-caused climate change to the total observed number of such days over the last five years to calculate how many were added by climate change.
Learn more about the CSI: explore the map tool, watch a video explainer, or read the FAQs.
Climate change at least doubled pregnancy heat-risk days in most countries
In most countries (222 of 247), climate change at least doubled the average annual number of pregnancy heat-risk days experienced during the past five years, compared to a world without climate change.
In nearly one-third (78) of countries, climate change added at least one additional month’s worth of pregnancy heat-risk days on average each year during 2020-2024. Many of these countries were located near the equator in the Caribbean and the Western Pacific.
Human-caused climate change added the most pregnancy heat-risk days primarily in developing regions with limited access to healthcare — most notably in the Caribbean, parts of Central and South America, the Pacific Islands, Southeast Asia, and sub-Saharan Africa.
Climate change added 48% more pregnancy heat-risk days in the U.S.
Human-caused climate change almost doubled the national average annual number of pregnancy heat-risk days in the U.S., compared to a world without climate change. During the past five years, 12 (48%) out of 25 average annual pregnancy heat-risk days were added by climate change.
In 21 states, 99 major U.S. cities, and the District of Columbia, climate change at least doubled the average annual number of pregnancy heat risk days during the past five years.
In Puerto Rico, 88% of average annual pregnancy heat-risk days (42 of 48) were added by climate change.
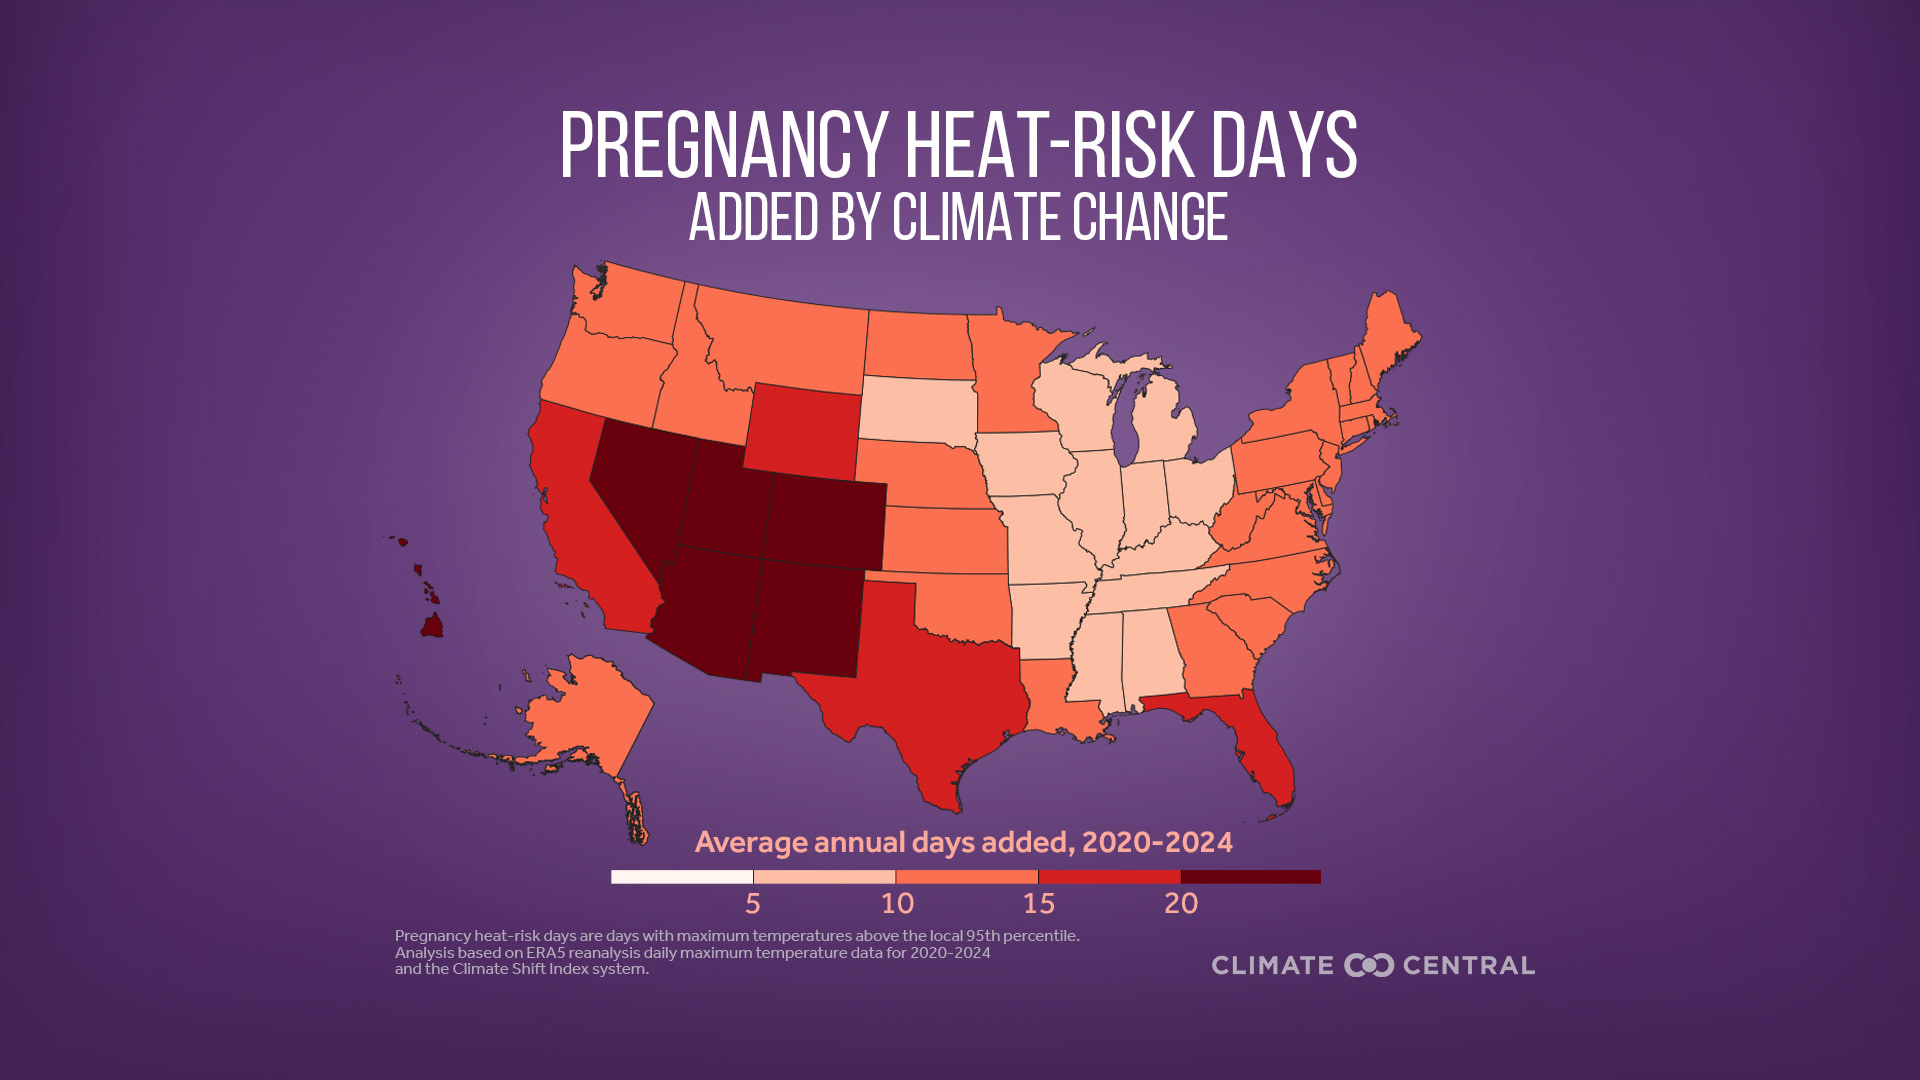
Pregnancy heat-risk days added by climate change in the U.S.
On average, every U.S. state experienced at least one additional week’s worth of pregnancy heat-risk annually due to climate change. Thirteen states experienced at least two additional weeks.
Cities across the U.S. Southwest had the highest average number of pregnancy heat-risk days added by climate change.
The states with the most pregnancy heat-risk days added by climate change from 2020 to 2024 were:
State | Average annual pregnancy heat-risk days | Average annual pregnancy heat-risk days added by climate change (% of days) |
|---|---|---|
Utah | 32 | 23 (72%) |
Colorado | 34 | 22 (65%) |
New Mexico | 33 | 21 (64%) |
Hawaii | 21 | 20 (95%) |
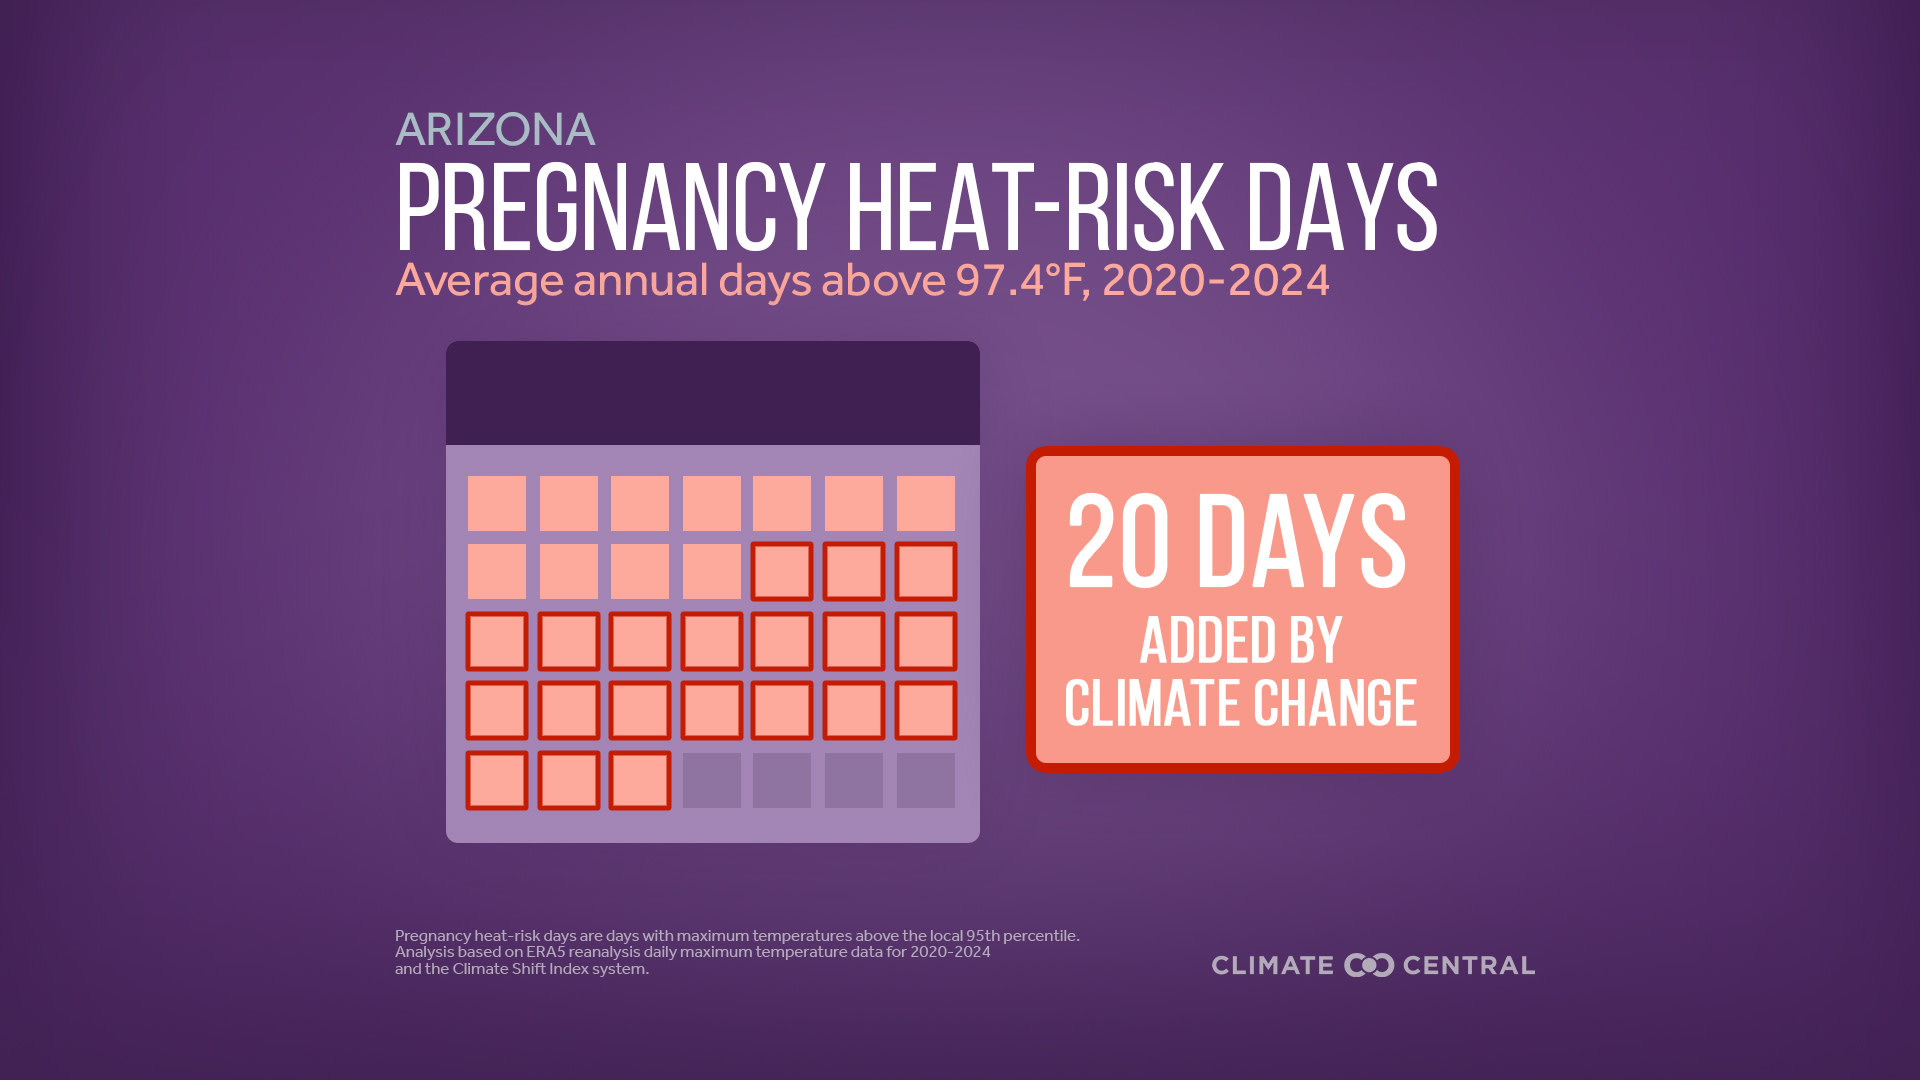
Arizona | 31 | 20 (65%) |
Nevada | 34 | 20 (59%) |
The U.S. cities that experienced the highest number of additional pregnancy heat-risk days due to climate change were West Palm Beach, Fla. (34); Miami, Fla. (30); and San Juan, P.R. (29); Salt Lake City, Utah (26); and Odessa, Texas (26).
Pregnancy heat risks in a period of unprecedented warming
This analysis provides a five-year snapshot of daily extreme heat impacts that reflect a long-term global warming trend that is driven by human activities. This period of analysis (2020-2024) includes the two hottest years on record (2023 and 2024), whose record-shattering global temperature anomalies are still not fully understood. Recent analysis indicates, however, that human activities accounted for 1.3°C (92%) of the total observed global temperature anomaly in 2023 (1.43°C).
Climate change impacts maternal health and birth outcomes
In addition to more frequent extreme heat, planet-warming carbon pollution contributes to other weather extremes that increase risks for pregnant people, including exposure to more air pollution (including smoke from wildfires), more frequent flooding, and potential displacement following storms.
Certain types of air pollution, including wildfire smoke, have immediate and long-term effects on maternal health, including heightened mental stress, hypertensive disorders of pregnancy, and gestational blood pressure.
Flooding events and their aftermath can pose severe health risks to pregnant people, like pregnancy loss and low birth weight, as well as expose them to contaminated floodwaters, debris, and other flood hazards.
Climate disasters can damage infrastructure critical to protecting pregnant people, like homes, healthcare services, and hospitals for delivery and postnatal care.
Extreme weather events can threaten mental health during or after pregnancy, especially in communities already dealing with housing, food, or financial insecurity. Prenatal stress can affect maternal health and pregnancy outcomes.
Rising climate-related risks to pregnant people threaten to reverse recent progress made in maternal and reproductive health.
Learn more about how climate change impacts pregnant, breastfeeding, and postpartum people from the U.S. Environmental Protection Agency.
Real Stories: Climate Disasters Inflict Outsized Harm on Pregnant and Young Families
Climate Central’s Partnership Journalism program collaborated with the Daily Yonder to tell the stories of pregnant women in rural Georgia affected by Hurricane Helene in 2024. Read the full story.
LOCAL STORY ANGLES
Check local temperature and heat risk forecasts.
HeatRisk is an interactive map tool from the National Weather Service, now available for the contiguous U.S. This color-numeric index shows current and forecast risk of daily local heat-related impacts.
Is climate change influencing daily heat extremes in your local area?
Climate Central’s Climate Shift Index (CSI) system provides tools, data, custom maps, and local alerts to answer this question in real-time. Here are three ways to use the CSI:
Use the tools. Climate Central’s Climate Shift Index map tool shows which parts of the world are experiencing high CSI levels, every day. Explore the global CSI map for today, tomorrow, and any day in the recent past.
Access KML to create custom CSI maps. The CSI is now available in KML format. Fill out this form to join our pilot project, receive the KML links, and create custom maps.
Sign up for alerts. Sign up here to receive custom email alerts when strong CSI levels are detected in your local area.
CONTACT EXPERTS
Bruce Bekkar, MD
Past chair, Public Health Advisory Council, San Diego
Climate for Health Fellow, ecoAmerica
Relevant expertise: women's health, pregnancy, birth outcomes, and climate change
Contact: greendoc@me.com
FIND EXPERTS
Submit a request to SciLine from the American Association for the Advancement of Science or to the Climate Data Concierge from Columbia University. These free services rapidly connect journalists to relevant scientific experts.
Browse maps of climate experts and services at regional NOAA, USDA, and Department of the Interior offices.
Explore databases such as 500 Women Scientists, BIPOC Climate and Energy Justice PhDs, and Diverse Sources to find and amplify diverse expert voices.
Reach out to your State Climate Office or the nearest Land-Grant University to connect with scientists, educators, and extension staff in your local area.
METHODOLOGY
Daily maximum temperatures were calculated relative to 1991-2020 normals using ECMWF ERA5 reanalysis temperature data. The 95th temperature percentile for states was calculated using spatially averaged data from ECMWF ERA5. Additionally, this analysis utilized counterfactual temperatures, or the temperatures that would have occurred in a world without human-induced climate change. These are estimated using Climate Central’s Climate Shift Index (CSI) system.
We counted the number of days with temperatures warmer than 95% of temperatures (also referred to as temperatures above the 95th percentile) observed at a given location. Research shows that this threshold can increase the risk of preterm birth. We define these extremely hot days as “pregnancy heat-risk days.” We chose the 95th percentile based on peer-reviewed research from Kuehn et al. (2017), Wang et al. (2013), Wang et al. (2024), and McElroy et al. (2022).
Using the CSI system, we estimated the number of pregnancy heat-risk days that would have occurred in a world without human-caused climate change (i.e., a counterfactual scenario) and compared that to the total number observed each year.
The analysis includes data for 247 major U.S. cities. Puerto Rico is one of the 247 countries In the full global analysis. For regional analysis, Washington, D.C. was classified as a state in the Northeast, while Alaska and Hawaii were treated as individual regions.
Values in the text, tables, and graphics have been rounded for clarity.
A full, detailed methodology is available in the report: www.climatecentral.org/report/pregnancy-heat-risks