Climate Matters•May 10, 2023
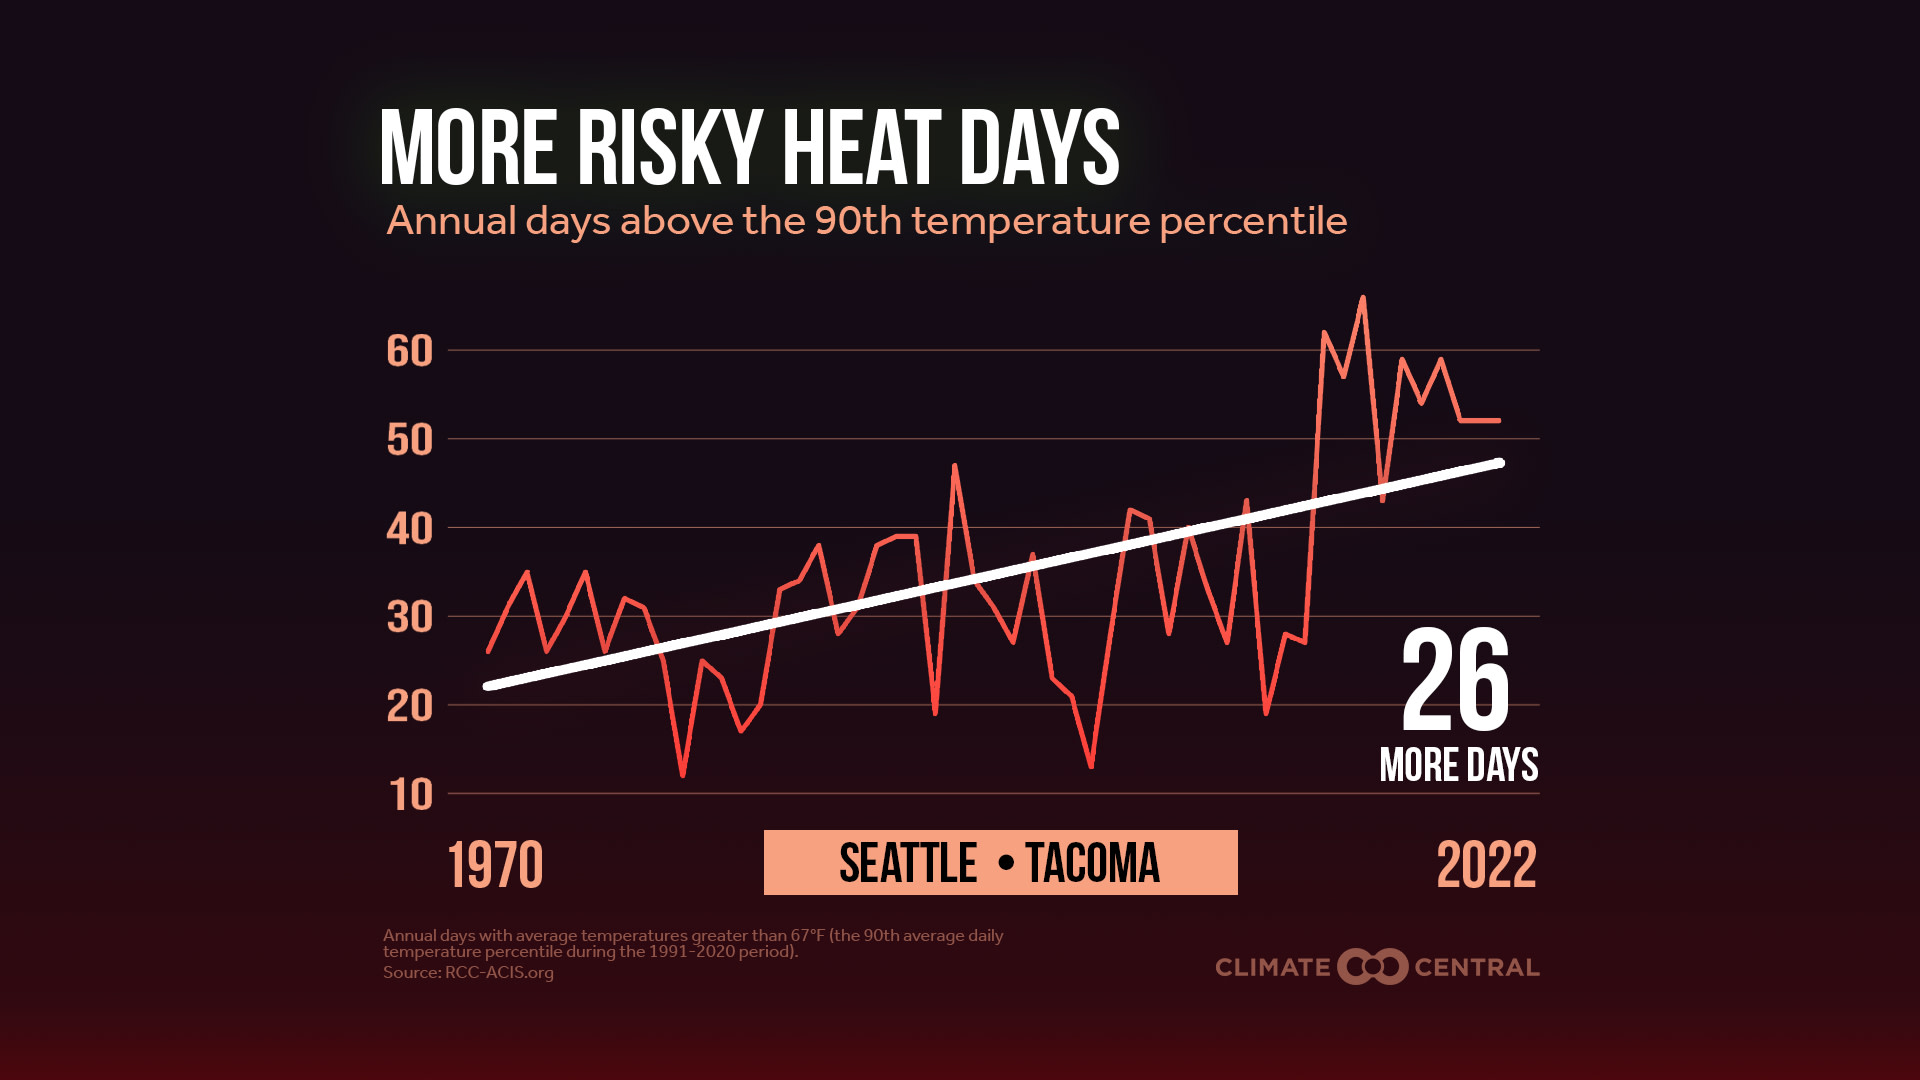
More Risky Heat Days in 232 U.S. Locations
KEY CONCEPTS
More frequent and intense extreme heat is an indicator of climate change—and a serious health risk.
When temperatures climb above the local minimum mortality temperature (MMT), the health risks also rise.
Climate Central analyzed the change in annual days above the local MMT in 247 U.S. locations from 1970 to 2022.
232 locations have seen the annual number of risky heat days increase—by 21 more days on average since 1970.
The South and Southeast were risky heat hotspots, but increases in days above local MMT were observed in every U.S. region
Extreme heat harms health
As average temperatures warm across the U.S. and the globe, extreme heat occurs more often.
More frequent extreme heat is not only an indicator of climate change—it’s also one of the most serious health risks in our warming climate.
Extreme heat is the deadliest natural hazard in the U.S. A recent study estimates that extreme heat accounted for 12,000 premature deaths in the contiguous U.S. from 2000 to 2010.
As temperatures climb, health risks rise
One indicator of the local links between temperature and mortality is called minimum mortality temperature (MMT).
A location’s MMT is the daily average temperature at which the risk of heat-related death is lowest.
The relative risks of heat-related illness and mortality increase steeply as temperatures climb above the local MMT.
A location’s MMT is generally near the hottest end of a location’s temperature distribution. Different cities have different MMTs, reflecting that these health-related heat thresholds vary based on the local climate and related long-term adaptation among local populations.
For example, the MMT in Anchorage, Alaska (59°F) is lower than in Austin, Texas (87°F) because in warmer climates like Austin, locals are generally accustomed to warmer temperatures, and adaptation measures to reduce heat-related risks (e.g., air conditioned buildings) are more widespread.
More risky heat days in 232 U.S. locations
Climate Central analyzed the annual number of days with average temperatures above the local MMT in 247 U.S. locations, from 1970 to 2022. The following results summarize trends for 244 locations (see Methodology).
The local MMT (the temperature above which heat-related health risks increase sharply) ranges across the locations analyzed—from 57°F in Juneau, Alaska, to 96°F in Phoenix, Ariz.
From 1970 to 2022, 232 locations (95% of the 244 locations) experienced an increase in the annual number of risky heat days (days above the local MMT).
On average, these 232 locations now experience 21 more days above their local MMT annually than in 1970.
Risky heat hotspots in the South and Southeast
Increases in risky heat days were widespread, but 22 locations experienced an increase of 40 or more days above their MMT during the study period. Of these 22 locations:
over two-thirds were in either Texas (nine locations) or Florida (six locations).
91% (20 of the 22 locations) were in the South or Southeast.
The top 10 increases in annual days above MMT from 1970 to 2022 were in:
| Location | Change in annual days above MMT |
|---|---|
| 1. Reno, Nev. | 64 days |
| 2. Panama City, Fla. | 60 days |
| 3. Tampa Area, Fla. | 58 days |
| 4. Albany, Ga. | 54 days |
| 5. Sarasota, Fla. | 54 days |
| 6. Austin, Texas | 53 days |
| 7. McAllen, Texas | 52 days |
| 8. Houston, Texas | 51 days |
| 9. Miami, Fla. | 49 days |
| 10. New Orleans, La. | 48 days |
Not just a southern story. Although the South and Southeast were risky heat hotspots in this analysis, it’s important to note that increases in days above local MMT were observed in every region of the U.S.
Climate connections
The widespread rise in risky heat days since 1970 is an indicator of the heat-related health impacts already being felt in the U.S. and beyond.
Warming from human activities already accounts for over one-third of heat-related deaths in 732 locations across 43 countries in recent decades (1991–2018), according to a recent study.
Climate Central’s Extreme Weather Toolkit: Extreme Heat includes more resources on the links between climate change and heat extremes.
Summer outlook
In the U.S., NOAA’s latest summer 2023 temperature outlook (issued on April 20) indicates a high likelihood of above-normal temperatures across the South, Southeast, and along the East Coast.
Furthermore, NOAA has issued a 62% chance of El Niño developing during May-July 2023, which could boost warm-season temperature extremes in the coming months.
NOAA’s next outlook will be issued on May 11.
A Climate Matters brief, El Niño and La Niña: Local and global effects, provides context.
Who is most at risk?
Extreme heat can affect everyone, but some face greater risks of heat-related illness and mortality than others.
Children, adults over 65, pregnant people, and people living with illness are particularly susceptible to heat-related illness.
Outdoor workers and athletes are also at elevated risk due to work- and recreation-related exposure to extreme heat.
Structural inequities can also lead to higher extreme heat exposure in some communities. For example, in 169 of the largest U.S. urban areas, people of color and people living below the poverty line are disproportionately exposed to urban heat island intensity, according to a recent study.
Costly adaptation strategies that can reduce the risks of extreme heat (for example, household air conditioning) also aren’t equally available to everyone.
Continued carbon pollution and future warming would likely worsen the unequal burdens of extreme heat. A 2021 EPA analysis found that, across 49 U.S. cities, low-income and Black individuals are 11% and 40%, respectively, more likely to currently live in areas that are projected to experience the most extreme future increases in heat-related mortality.
LOCAL STORY ANGLES
How is extreme heat affecting public health in your local area?
The 2018 National Climate Assessment details how the rise of extreme heat is already impacting health. In addition, the Centers for Disease Control and Prevention (CDC) maps census tract-level heat-related illnesses in its Heat and Health Tracker. Check the U.S. Department of Health and Human Services monthly Climate and Health Outlook for extreme heat outlooks in your region throughout the summer.
To identify at-risk counties now and in the future, check out this Future Heat Events and Social Vulnerability mapping tool.
What is being done in your local area to reduce heat exposure among vulnerable populations?
Use the National Integrated Heat Health Information System (NIHHIS) Heat Equity Mapper to explore the burden of extreme heat at the census tract level. Track local climate-related hazards in real-time in the Climate Mapping for Resilience and Adaptation Portal, which also includes federal resources for long-term resilience planning. Explore data and reports from NOAA’s urban heat island mapping campaigns in 60+ U.S. cities and learn about risk reduction and adaptation strategies in each. The NIHHIS Heat.gov site includes preparedness and planning resources, and the White House recently released a compilation of Planning Tools for Combatting Extreme Heat.
How is climate change influencing daily heat extremes in your local area?
Climate Central’s U.S. Climate Shift Index™ Map tool provides real-time estimates of how much climate change is affecting daily high and low temperatures across the entire U.S. The Global Climate Shift Index™ Map tool shows the influence of climate change on daily average temperatures across the entire globe.
CONTACT EXPERTS
Angel Hsu, PhD
Assistant Professor
University of North Carolina
Relevant expertise: urban heat island exposure
Contact: angel.hsu@unc.edu
Adelle Monteblanco, PhD (she/her)
Assistant Professor, Public Health
Pacific University Oregon
Relevant expertise: extreme heat health impacts on vulnerable populations
Contact: adelle.monteblanco@pacificu.edu
FIND EXPERTS
Submit a request to SciLine from the American Association for the Advancement of Science or to the Climate Data Concierge from Columbia University. These free services rapidly connect journalists to relevant scientific experts.
Browse maps of climate experts and services at regional NOAA, USDA, and Department of the Interior offices.
Explore databases such as 500 Women Scientists, BIPOC Climate and Energy Justice PhDs, and Diverse Sources to find and amplify diverse expert voices.
Reach out to your State Climate Office or the nearest Land-Grant University to connect with scientists, educators, and extension staff in your local area.
METHODOLOGY
The minimum mortality temperature is approximated as the 90th percentile average daily temperature over the last normal period (1991-2020). Climate Central calculated the number of annual days the average temperature exceeded the minimum mortality temperature from 1970–2022 for 247 U.S. locations. However, for data summaries based on linear trends, only 244 stations are included due to large data gaps in Dothan, Ala., Hazard, Ky., and Wheeling, W.Va.
Tobías et al. (2021) estimated local MMT in 683 global locations using local temperature and mortality data, and calculated the MMT percentile (MMTP) for each location, defined as “the percentile of the temperature distribution corresponding to the MMT." Of the 211 U.S. locations analyzed by Tobías et al. (2021), 95% had a MMTP that corresponds to the 90th temperature percentile. This is broadly consistent with Gasparrini et al. (2015), who estimated local minimum mortality percentiles (MMP) for 135 U.S. cities, and found that the median MMP across these 135 cities was the 84th percentile.