Climate Matters•September 7, 2022
Hurricane Intensity and Impacts
KEY CONCEPTS
Warming oceans are fueling stronger tropical cyclones—the most costly and deadly weather disasters in the U.S.
Of the 10 most costly weather disasters in U.S. history, eight were hurricanes.
About 80% of major hurricanes undergo rapid intensification. In the Atlantic, 170 landfalling tropical cyclones have experienced rapid intensification since 1980.
Of the 56 tropical cyclones that have caused at least $1 billion in damage in the U.S. from 1980-2021, 73% underwent rapid intensification.
Landfalling tropical cyclones
The 2022 hurricane season has been quiet so far, but NOAA still predicts above-average activity (as of August 4). And as we’ve seen in recent years, it only takes one major hurricane to cause widespread devastation and damage. To mark the peak of Atlantic hurricane season (September 10), we’re looking at the high costs of hurricane rapid intensification.
Tropical cyclones, which include hurricanes and tropical storms, are the most deadly and costly weather disasters in the U.S. by far. Tropical cyclones with damages exceeding $1 billion account for a total of $1.19 trillion in damage since 1980—more than half of the cost of all billion-dollar disasters since then.
Of the 10 most costly weather disasters in the U.S., eight were hurricanes. The top three (Hurricanes Maria, Harvey, and Katrina) resulted in a total of 4,903 lives lost and over $442 billion in damages.
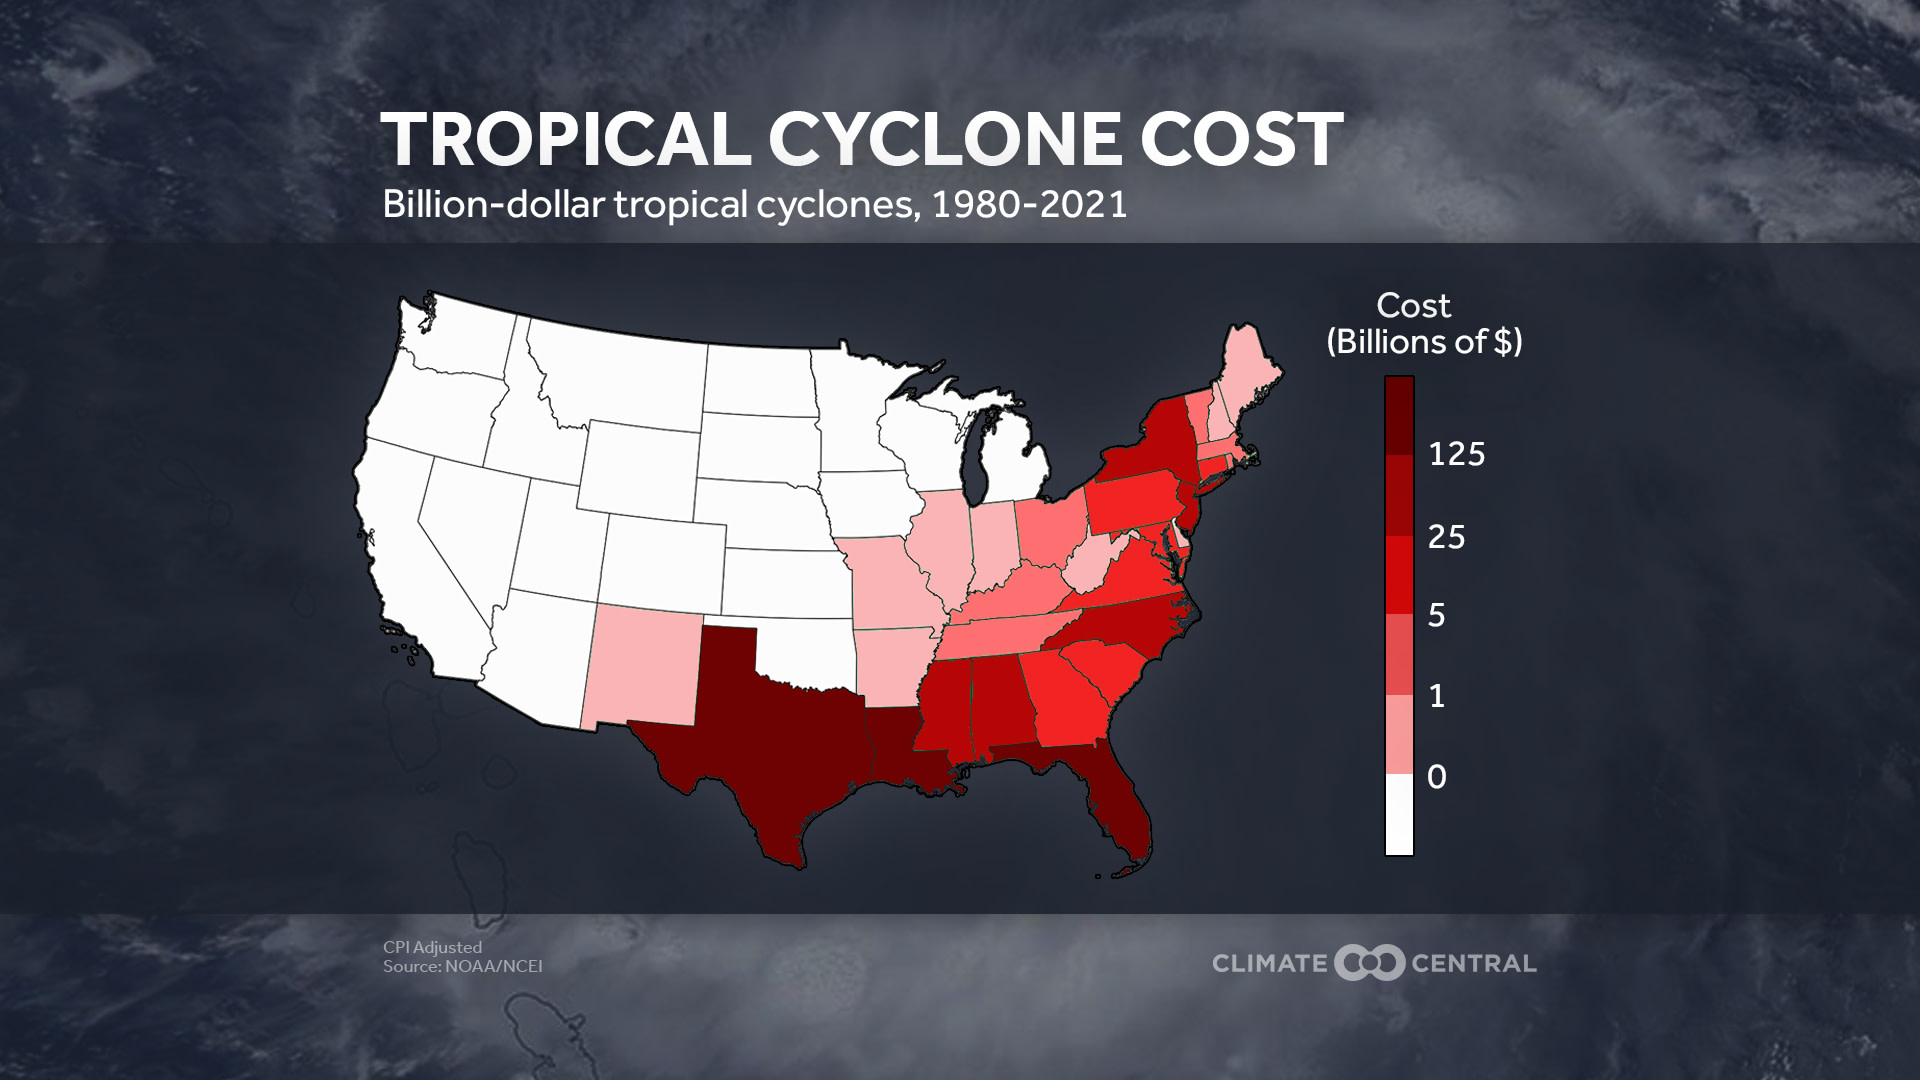
Total billion-dollar tropical cyclone costs are highest in Louisiana, Texas, and Florida—but extend to 29 states throughout the South, Southeast, Northeast, and Ohio Valley, as well as to Hawaii, Puerto Rico, and the U.S. Virgin Islands.
Tropical cyclones can generate multiple devastating hazards including storm surge, heavy rainfall, flooding, winds of 100 mph or more, and tornadoes. About half of the fatalities in the U.S. attributed to Atlantic tropical cyclones from 1963-2012 were due to storm surge. Another 27% of fatalities were due to heavy rainfall, which increases the risk of flooding far from the coast. The risks multiply when hurricane-induced power outages overlap with other extreme events such as heatwaves.
Rapidly intensifying hurricanes
About 80% of major hurricanes (category 3-5) undergo rapid intensification—defined as an increase in the maximum sustained winds of a tropical cyclone of at least 30 kt (about 35 mph) in a 24 hour period. It can be challenging to forecast rapid intensification, and this contributes to the high human and financial toll of such storms.
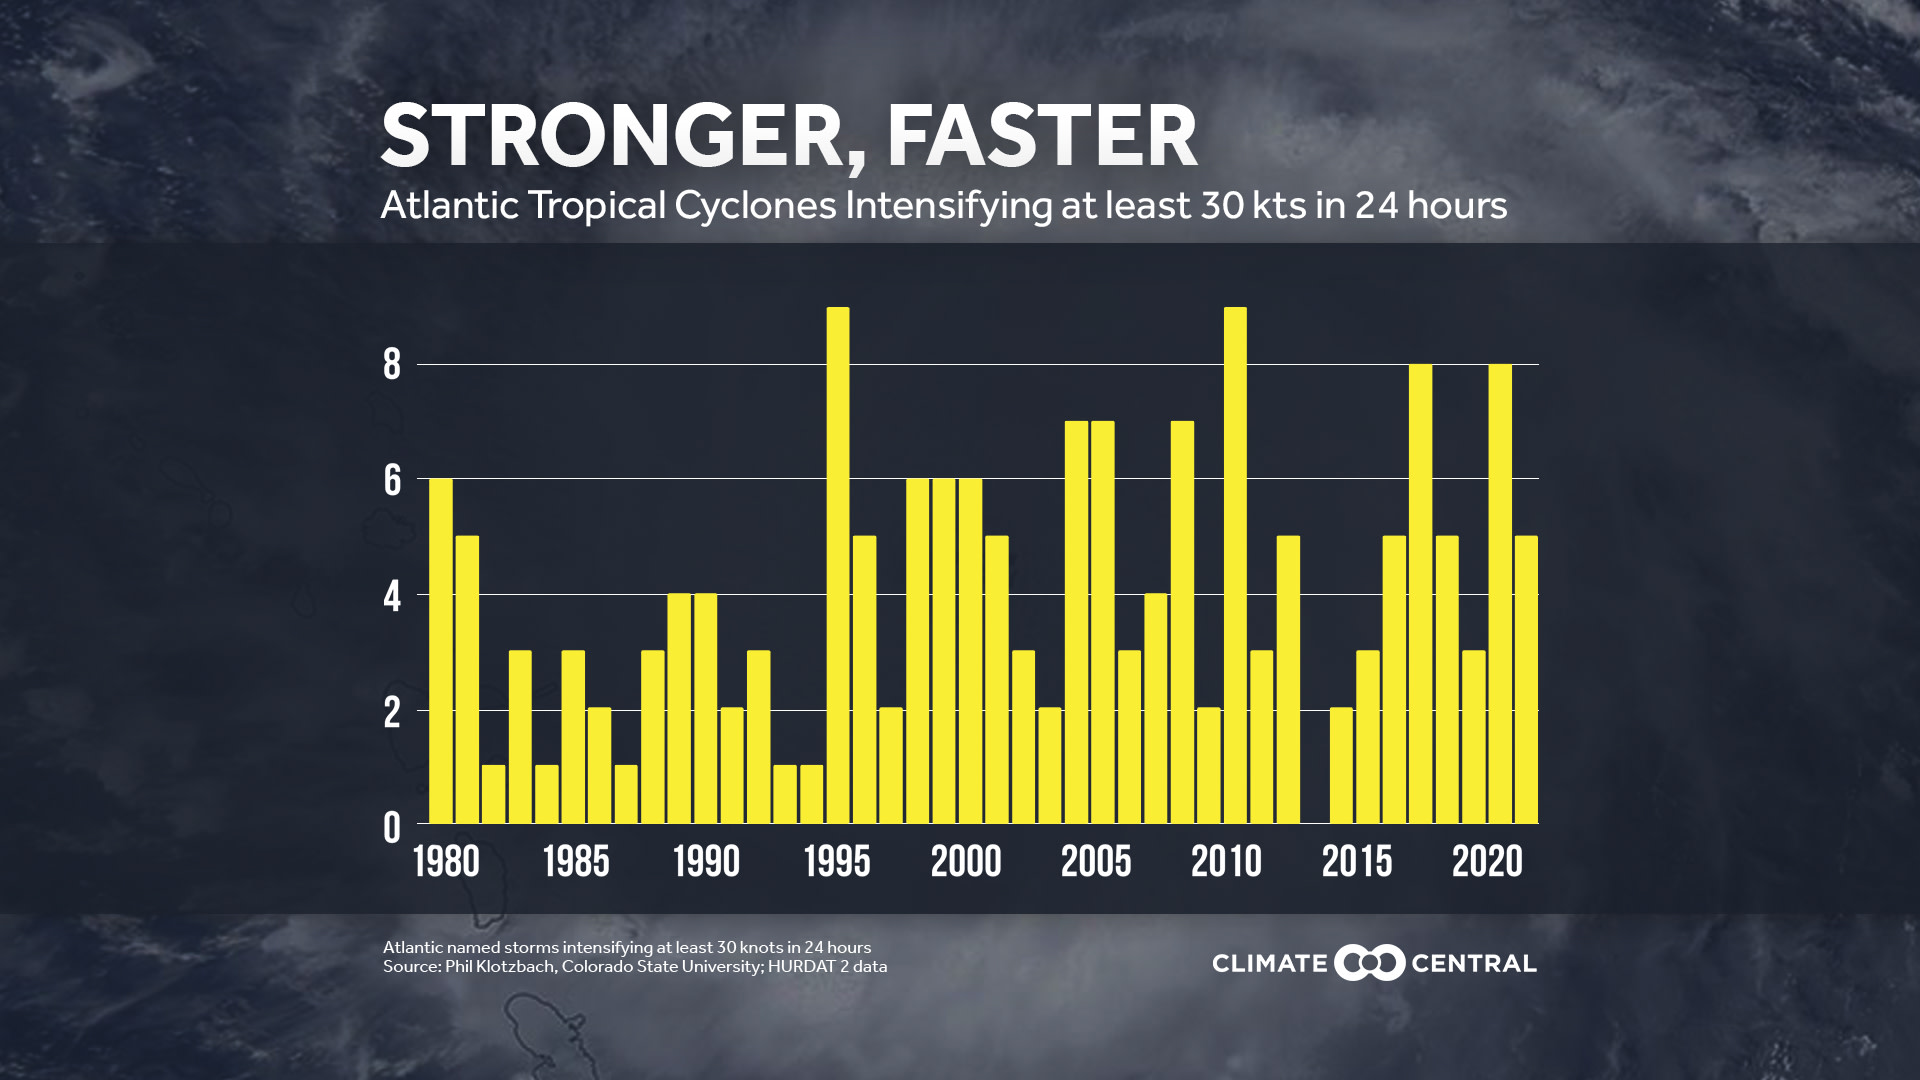
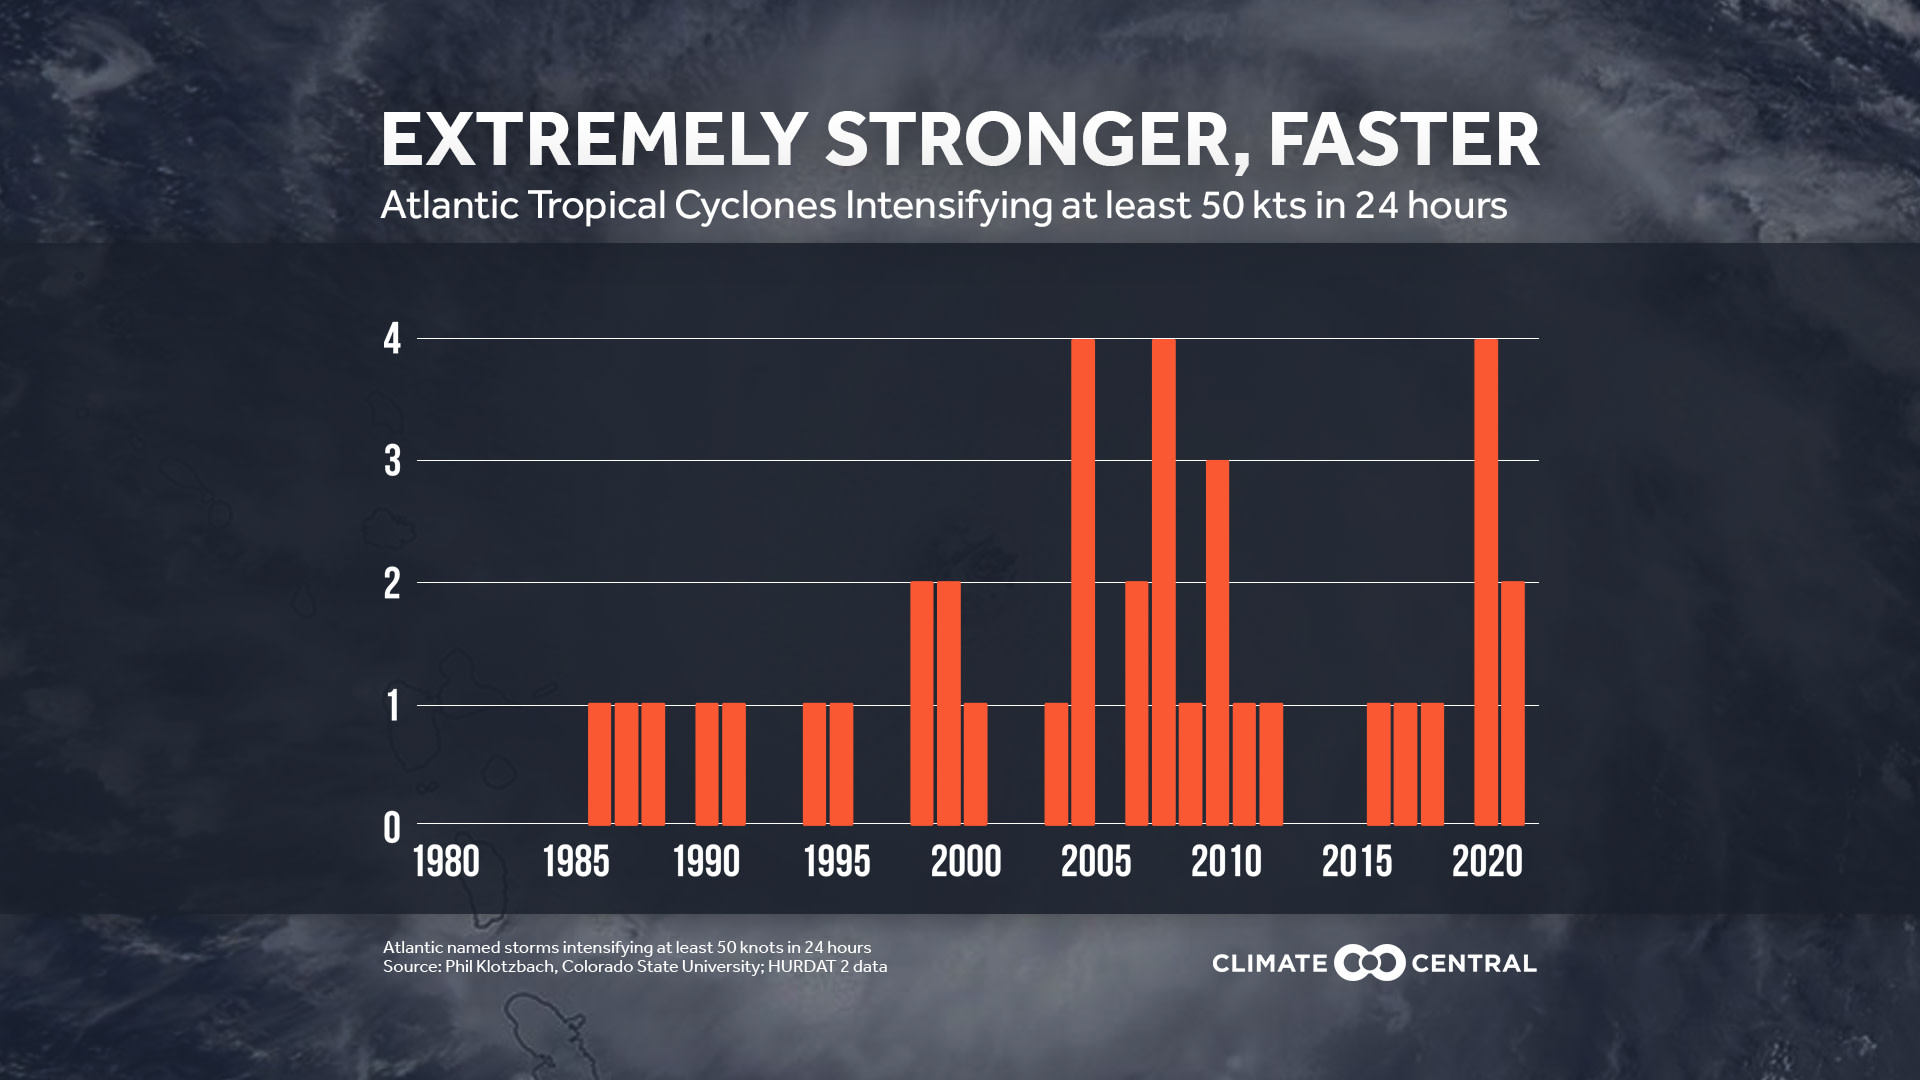
From 1980-2021, 170 landfalling Atlantic tropical cyclones experienced rapid intensification above the 30 kt threshold. Of these storms, 22% (38) experienced extreme rapid intensification (an increase in maximum sustained winds of at least 50 kt (about 58 mph) in a 24 hour period).
Of the 56 tropical cyclones that have caused at least $1 billion in damage in the U.S. from 1980-2021, 73% underwent rapid intensification.
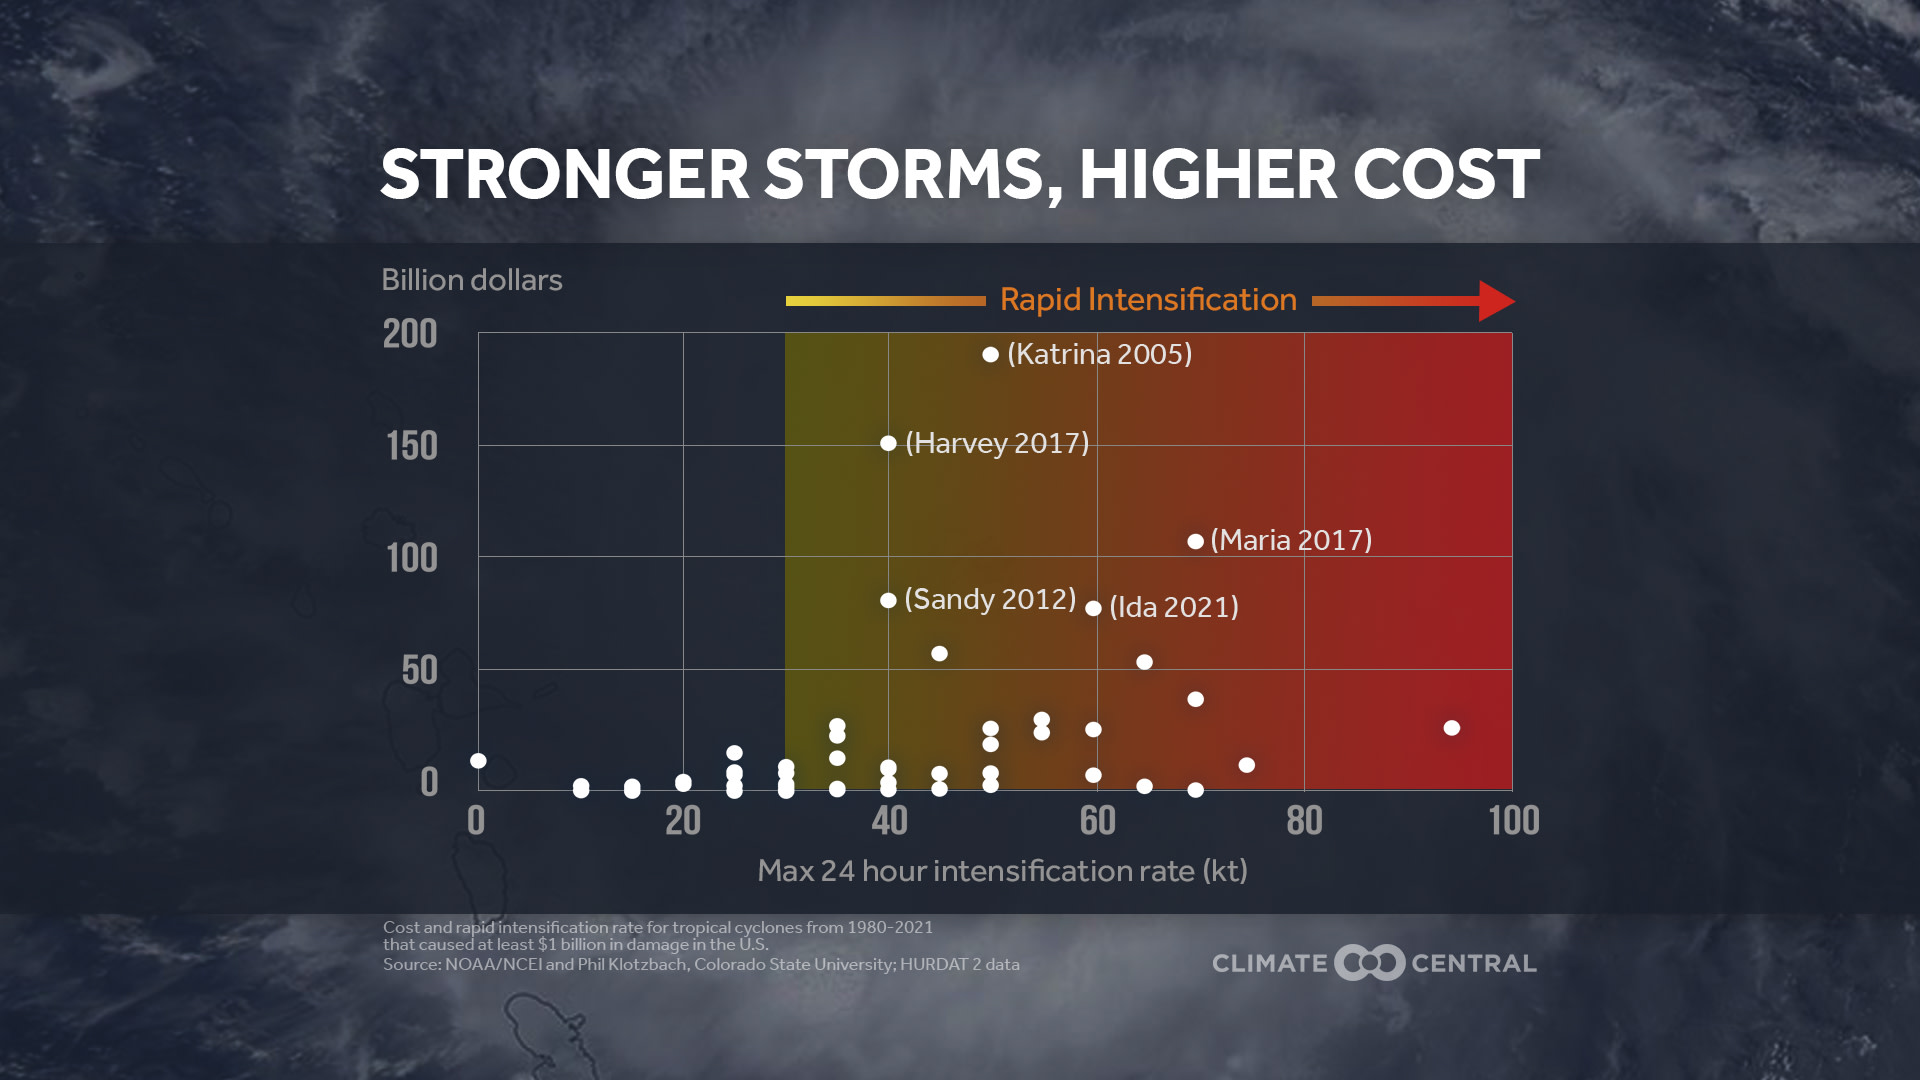
The five most costly hurricanes had maximum rapid intensification rates between 40-70 kt in 24 hours:
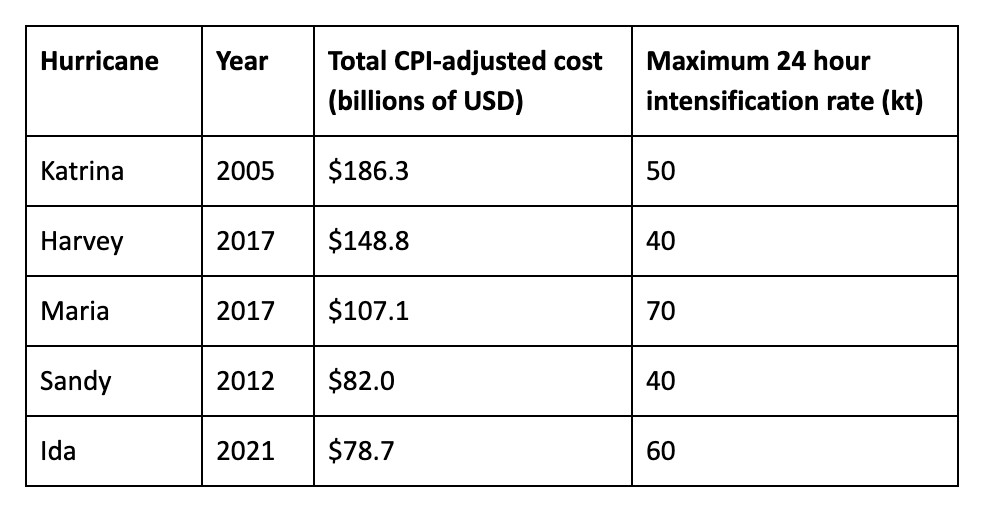
Observations show an increase in tropical cyclone intensification rates in the Atlantic basin from 1982-2009. And on a global scale, extreme rapid intensification events (50+ kt in 24 hrs) have increased significantly from 1990 to 2021, likely primarily due to warming sea surface temperatures.
Tropical cyclones and climate change
The effects of climate change on hurricanes are complex, but research shows rising temperatures are causing hurricanes to become more intense. Higher tropical cyclone rainfall rates are expected with further warming. And rising sea levels further enhance the risk of flooding from tropical cyclones, sometimes increasing hurricane damages by billions of dollars.
Ocean warming due to human-caused climate change is fueling an increased proportion of intense tropical cyclones and contributing to an increased fraction of storms that undergo rapid intensification.
Since 1979, human-caused warming has increased the global likelihood of a tropical cyclone developing into a major hurricane (category 3 or higher) by about 8% per decade. The latest IPCC reports conclude that the proportion of very intense (category 4 and 5) tropical cyclones is projected to increase globally with continued warming.
Rising losses from tropical cyclones
The risks from tropical cyclones reflect a combination of three factors:
physical hazards that result from tropical cyclones (e.g., storm surge),
exposure of people and property to these hazards where and when they occur, and
the vulnerability of populations in the storm track (e.g., capacity to respond and recover).
While the frequency of landfalling hurricanes in the continental U.S. hasn’t changed from 1900-2017, the resulting economic losses have increased significantly over the same period. Population growth and regional wealth along the U.S. Gulf and East Coasts (increased exposure) are reflected in the increased damage.
POTENTIAL LOCAL STORY ANGLES
Resources on climate change and tropical cyclones:
NOAA regularly updates a comprehensive summary of the science on Global Warming and Hurricanes, and offers a hurricane season Media Resource Guide. Climate Central’s Extreme Weather Toolkit: Tropical Cyclones provides reporting resources and multimedia graphics in English and Spanish.
Current storm forecasts:
NOAA’s National Hurricane Center monitors current conditions and provides 2-day and 5-day outlooks for the Atlantic, Eastern Pacific, and Central Pacific.
Official guidance on hurricane safety and preparedness:
NOAA’s National Hurricane Preparedness site includes safety tips, resources to determine local hurricane risk and evacuation zones, and guidance on insurance checkups. The Ready.Gov hurricanes site provides guidance in 13 languages. The CDC’s Preparing for Hurricanes During the COVID-19 Pandemic site provides additional guidance.
Mapping local hurricane risk:
The FEMA Flood Map Service Center provides searchable flood maps by address. NOAA’s National Storm Surge Risk Maps can be used to assess risk in hurricane-prone coastal areas. FEMA’s National Risk Index maps provide hurricane risk levels for counties and census tracts in the contiguous U.S.
LOCAL EXPERTS
The SciLine service, 500 Women Scientists or the press offices of local universities may be able to connect you with local scientists who have expertise on hurricanes and climate change. The American Association of State Climatologists is a professional scientific organization composed of all state climatologists.
NATIONAL EXPERTS
Susan Cutter, PhD
Carolina Distinguished Professor; Director of the Hazards Vulnerability & Resilience Institute
University of South Carolina
Contact: scutter@sc.edu
Related expertise: hazards risk and disaster; Vulnerability science
Daniel Gilford, PhD
Climate Scientist
Climate Central
Contact: dgilford@climatecentral.org
Related expertise: tropical cyclone intensity and coastal impacts
Gabriel Vecchi, PhD
Professor of Geosciences
Director, High Meadows Environmental Institute
Princeton University
Contact: gvecchi@princeton.edu
Related expertise: tropical meteorology and climate change
*Available for interviews in Spanish and English
Kimberly Wood, PhD
Associate Professor
Mississippi State University
Contact: kimberly.wood@msstate.edu
Related expertise: tropical cyclones and rapid intensity change
METHODOLOGY
Special thanks to Dr. Phil Klotzbach of the Colorado State Tropical Meteorological Project for assistance. A rapid intensification period (RI) is defined by the National Hurricane Center as an increase in the maximum sustained wind speed of at least 30 knots (approx 35 mph) in 24 hours. Hurricane data were collected from the HURDAT2 dataset and intensity of storms was analyzed at synoptic times (00, 06, 12, 18 GMT). Only storms that had reached tropical storm status were considered for the rapid intensification analysis and subtropical systems were excluded. Because of limitations in detection (before satellite and aircraft reconnaissance), HURDAT2 data before 1980 were excluded in this analysis.