Climate Matters•October 11, 2022
Billion-Dollar Disasters in 2022
KEY CONCEPTS
As of this month, the U.S. has experienced 15 billion-dollar weather and climate disasters so far in 2022—already well above the historical average of seven events per year.
This year’s mounting extreme weather costs reflect an increasing trend in U.S. billion-dollar disasters since 1980.
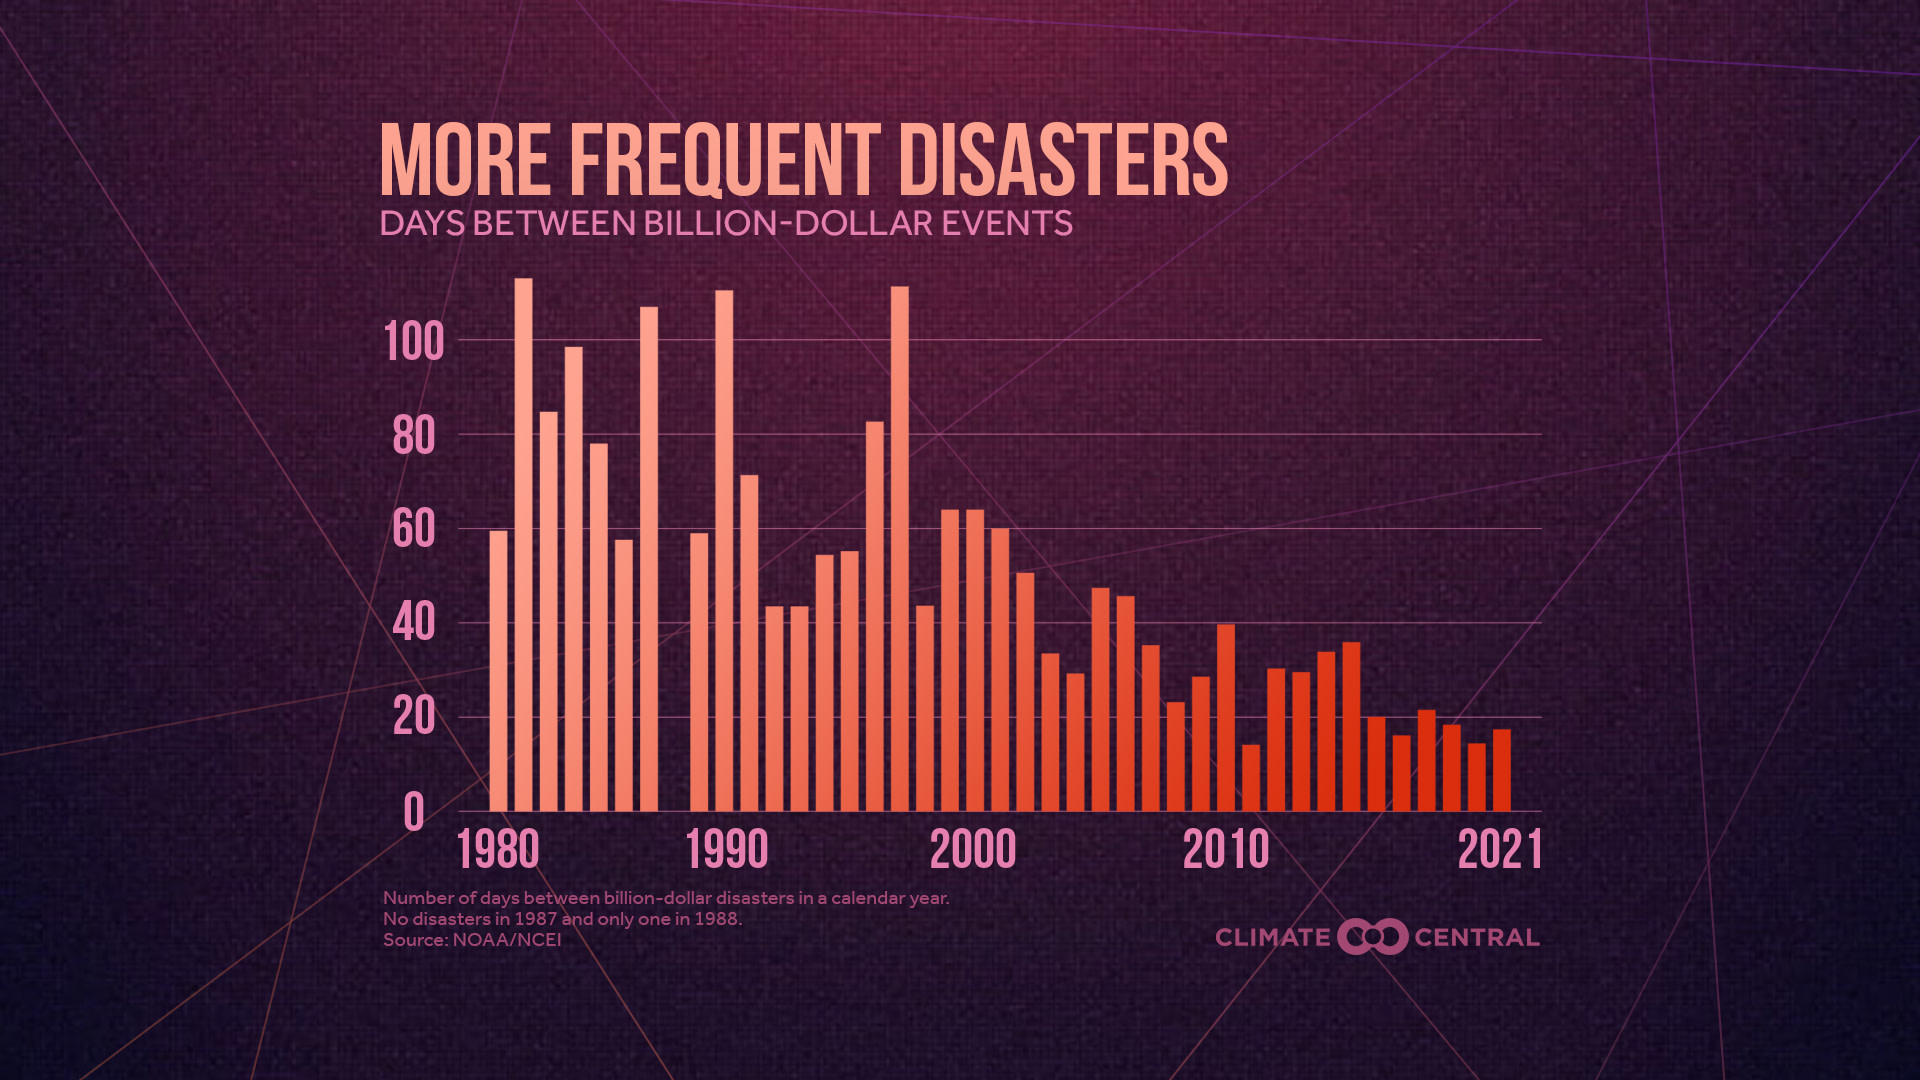
The frequency of billion-dollar disasters has also increased. In the last five years (2017-2021), there were just 18 days on average between billion-dollar disasters—compared to 82 days in the 1980s.
Less time between disasters can mean less time and resources available to respond, recover and prepare for future events.
The full toll of such events—including the impacts on health—can’t be captured in any one statistic. Without rapid cuts in heat-trapping emissions, this toll is likely to keep rising.
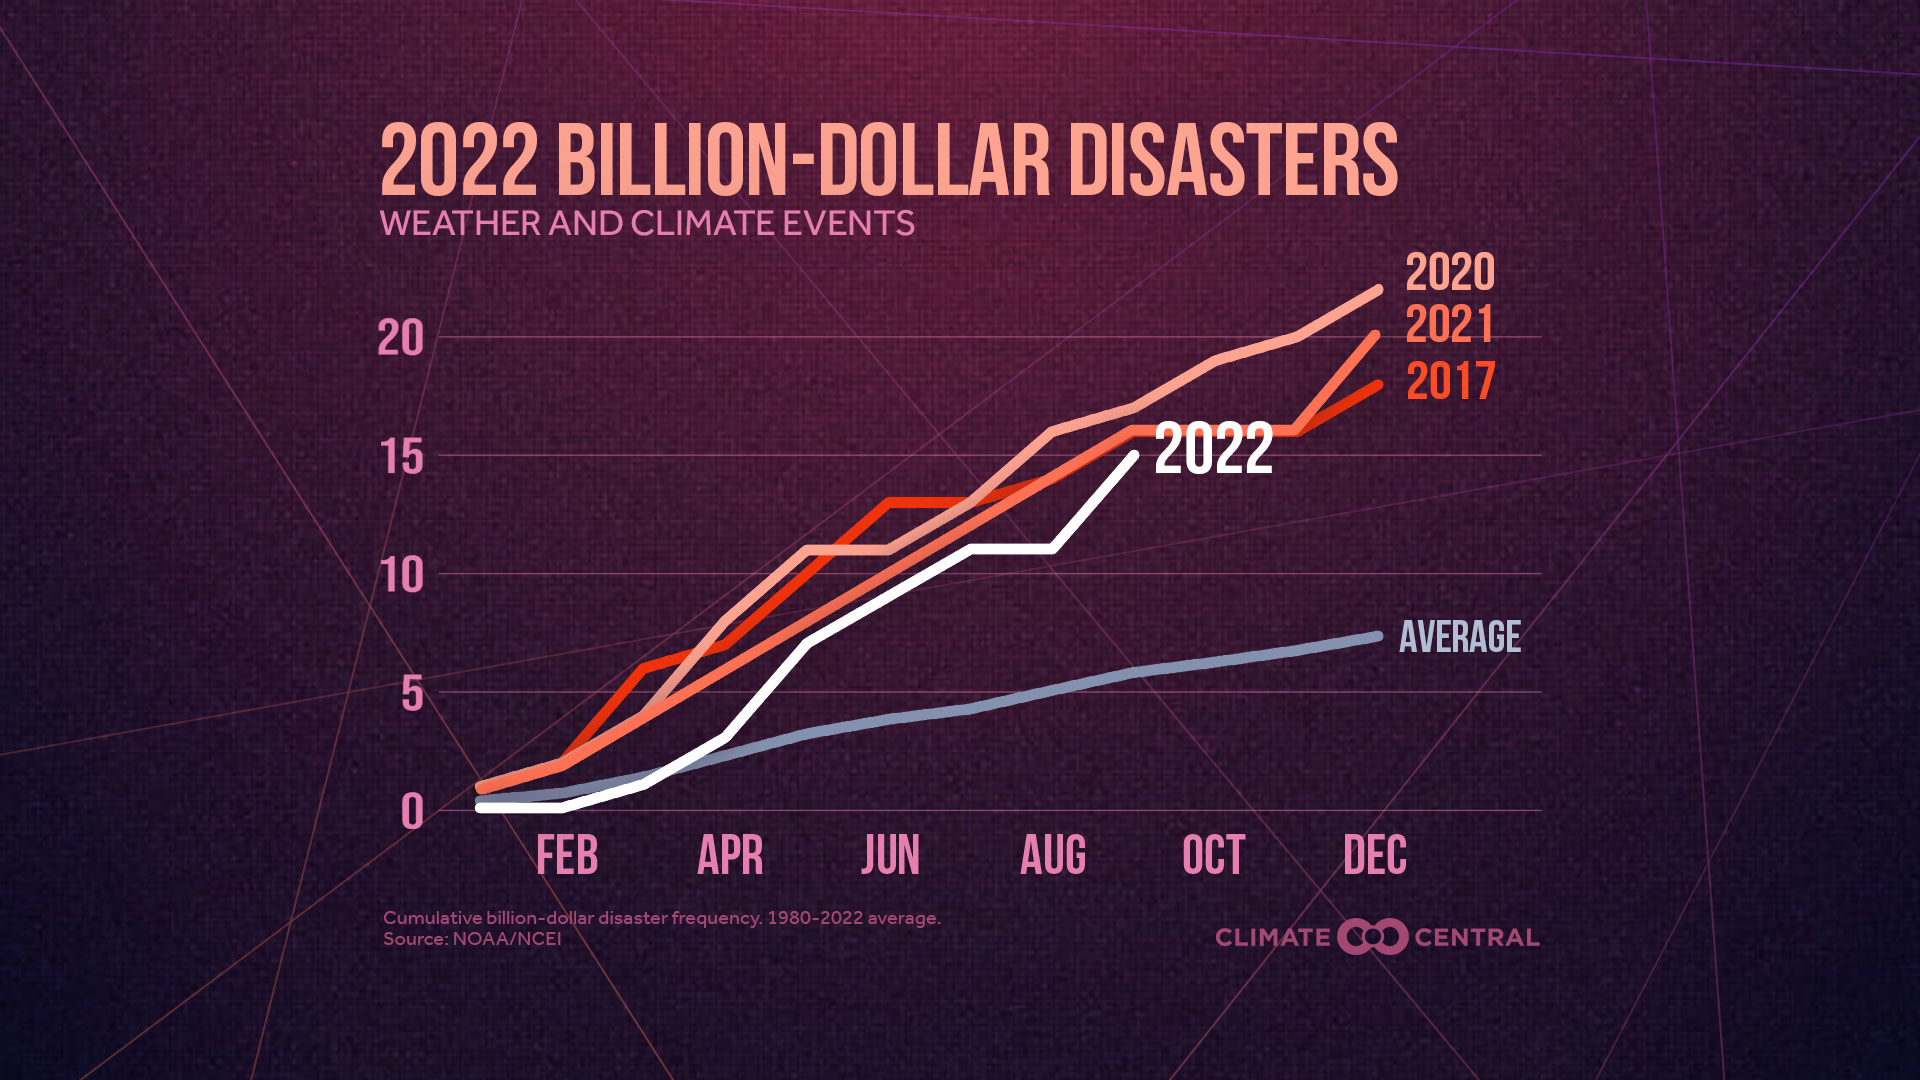
Billion-dollar disasters in 2022
The devastation wrought by Hurricanes Fiona and Ian in Puerto Rico, Florida, and beyond has once again thrust weather and climate disasters to the forefront of the nation’s attention.
According to NOAA, the U.S. has experienced 15 weather and climate disasters with losses exceeding $1 billion each in 2022 (as of September 30). The total cost of these disasters through the end of September was $29.3 billion. Adding up the final costs will take months after the end of the year to complete.
The costly and deadly billion-dollar disasters of 2022 so far have included:
an April tornado outbreak in the Southeast that spawned 88 tornadoes, including several intense, long tracked tornadoes in Georgia and South Carolina
a May hail storm that left large swaths of golf-ball sized hail across Minnesota, Wisconsin and South Dakota
a destructive derecho that produced widespread 70+ mph wind gusts across the lower Midwest
The costs of Hurricane Fiona and Hurricane Ian are still being accounted for as ongoing recovery continues. Historically, hurricanes and tropical cyclones are the most costly disasters by far, averaging $21 billion per event—more than double the average toll of the next most costly event type (drought).
More Disasters
This year’s mounting extreme weather costs reflect an increasing trend in billion-dollar disasters across the U.S. Each decade since the 1980s has experienced more billion-dollar disasters and higher costs than the decade before.
Over the last five years (2017 to 2021) alone, a total of 89 events caused an estimated 4,557 deaths and over $788 billion dollars in damage. That’s about 35% of the $2.27 trillion in total costs of U.S. billion-dollar disasters from 1980-2021.
2022 is the eighth consecutive year with 10 or more billion-dollar weather and climate-related disasters. The long-term (1980–2021) annual average is about seven billion-dollar disasters per year. And 2022 follows the record-shattering annual totals of 22 and 20 billion-dollar disasters in 2020 and 2021, respectively.
More Often
It's not just the total number of disasters—but how often they occur—that strains the resources available for communities to manage risks and recover quickly.
Between 1980-2021, the time between billion-dollar disasters in a calendar year has dropped steadily, according to an analysis by Climate Central.
The average time between billion-dollar disasters has dropped from 82 days in the 1980s to 26 days in the 2010s.
In the last five years (2017-2021), there have been just 18 days on average between billion-dollar disasters.
During 2020, there were as little as two weeks on average between the record 22 billion-dollar disasters that year.
Less time between disasters can mean less time and resources available to respond, recover and prepare for future events.
The highest costs have resulted when multiple disasters occur in the same region and season, straining local resources—as during the Atlantic hurricane seasons of 2005 and 2017. According to NOAA, multiple billion-dollar tropical cyclones during these two seasons resulted in more than 5,000 lives lost and over $520 billion in combined damages.
The full toll of disasters
These staggering figures primarily reflect direct impacts on assets (including damage to homes, crops, and critical infrastructure), and therefore don’t reflect the full toll of disasters, including on public health—and especially mental health. According to the American Public Health Association, up to 54% of adults and 45% of children suffer depression after a disaster.
Weather and climate-related disasters can also result in widespread power outages (as occurred in Puerto Rico after Hurricane Fiona), displacement, and limited or unsafe food and water supplies, as well as loss of cultural heritage, biodiversity and habitats.
These figures also don’t convey the disproportionate impacts of disasters on people in poverty or the need for equitable allocation of federal disaster assistance in accordance with social vulnerability.
Disasters in a warming world
According to the latest IPCC reports, it is an “established fact” that human-caused greenhouse gas emissions have “led to an increased frequency and/or intensity of some weather and climate extremes since pre-industrial times.” And these trends are projected to continue with additional warming.
The ambition of the Paris Agreement—to limit warming to 2.7°F (1.5 °C) by 2100—is very likely to be exceeded by the mid-2040s at the latest without rapid emissions cuts. In November, nearly 200 nations will convene at the United Nations Climate Change Conference (COP27) to accelerate climate action. Without such progress, we can expect even more frequent and intense billion-dollar disasters in the future.
POTENTIAL LOCAL STORY ANGLES
What’s the cost of billion-dollar disasters in your local area?
Billion-dollar disasters have impacted all 50 states, the Virgin Islands and Puerto Rico. The NOAA/NCEI website includes interactive tools for visualizing and summarizing billion-dollar disaster statistics. These tools can quickly identify the most costly and frequent types of disasters in your state or region for any time period from 1980-2022.
Not all disasters are billion-dollar disasters.
FEMA maintains a nationwide database of all disaster declarations and public assistance that is searchable by state or zip code. You can also search for current and historical National Flood and Insurance Program (NFIP) policy and claims statistics by state or county.
Is your county or city prepared for these events?
Climate Mapping for Resilience and Adaptation integrates information from across the federal government to help people consider their local exposure to climate-related hazards. Local officials and state emergency management agencies can provide information about official disaster planning, emergency response, and available state-funded and federal disaster assistance programs. The Society for Environmental Journalism has compiled disaster resilience resources to support local reporting.
LOCAL EXPERTS
The SciLine service, 500 Women Scientists or the press offices of local universities may be able to connect you with local scientists who have expertise on weather extremes and climate change. The American Association of State Climatologists is a professional scientific organization composed of all state climatologists.
NATIONAL EXPERTS
Adam Smith, PhD
Applied Climatologist
National Centers for Environmental Information (NCEI)
Expertise: Lead scientist for NOAA’s U.S. Billion-dollar Weather and Climate Disasters research, analysis and public/private data partnerships (www.ncdc.noaa.gov/billions)
Contact: Adam.Smith@noaa.gov
METHODOLOGY
The time between billion-dollar disasters was calculated by measuring the time between the start date of each disaster as recorded by NOAA/NCEI. The difference in days was only for calendar year events, with the first event of the calendar year set as the first date. For this reason, there are no data points for 1987 and 1988, which had zero events and only one event, respectively.
How we use cookies
Climate Central uses cookies to personalize visitors' experiences and save time by remembering settings (learn more). By continuing to use our site, you accept this policy.